Research Highlights 2013
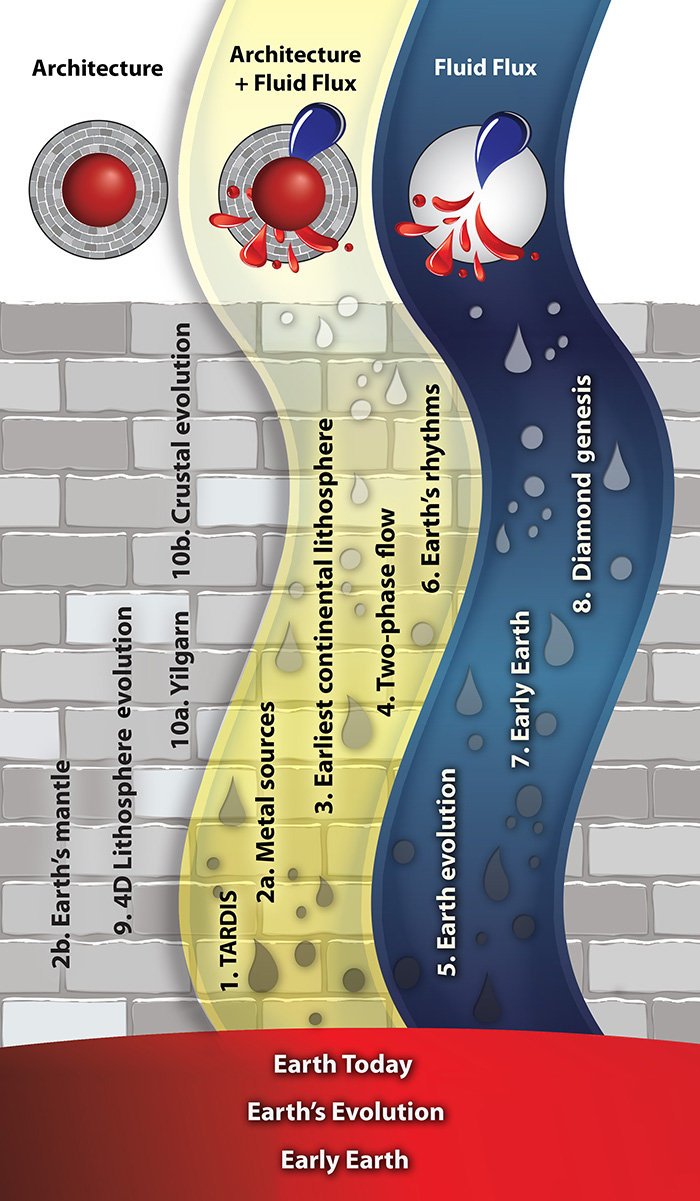
Following the new conceptual framework outlined on page 3, these Research highlights are identified as contributing to understanding Earth Architecture (the roadmap for fluids) and/or Fluid Fluxes (the “traffic report”), with logos for easy attribution. For a full description of the foundation projects,, see Appendix 1.
The GLAMour of mineral exploration
Giant magma-related ore systems are prime targets for modern mineral exploration – but how do they form? The Global Lithospheric Architecture Mapping (GLAM) project undertaken with industry collaboration has delivered an integrated model for more efficient global targeting of some key magma-related ore deposits. The magmas responsible for several types of ore deposit must pass through the stagnant subcontinental lithospheric mantle (SCLM) on their way to the surface - so how much control does the SCLM exert on the formation and localisation of the ores? GLAM has demonstrated that the 3D architecture of the SCLM influences the emplacement and fertility of such magmas. The GLAM outcomes to date are summarised in an invited article in Nature Geoscience (CCFS Publication #207), where we present evidence that the structure and evolution of the SCLM is directly relevant to the genesis and localisation of several types of major ore deposits, including diamond, Ni-Cu-(PGE), PGE and (Cu-)Au deposits.
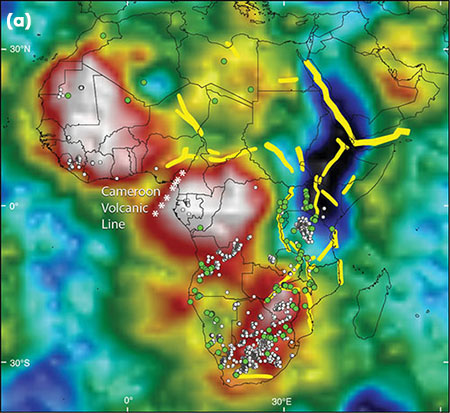
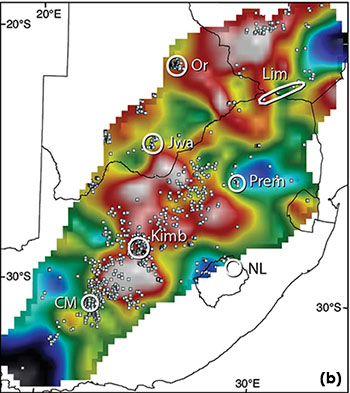
Figure 1. (Full references and sources given in Griffin et al., 2013, Nature Geoscience: CCFS Publication #207) Vs tomography (100-150 km) of the lithospheric mantle. Red to white colours indicate high Vs; blue colours low Vs. (a) Africa, showing distribution of low-volume magmatic rocks along the boundaries of high-velocity blocks. Young rift basins shown in yellow.
(b) Detailed seismic tomography over part of the Kaapvaal craton, showing kimberlites around the margins of high-velocity volumes. Major kimberlite provinces: Kimb, Kimberley district; NL, Northern Lesotho; Prem, Premier; Jwa, Jwaneng district; Or, Orapa district; Lim, Limpopo Belt, including kimberlites such as Venetia.
(c) Vp tomography (90 km depth, of western USA, showing major (magmatic-)hydrothermal ore deposits by size (largest, supergiant; medium, giants; smallest, majors) and dominant metals (yellow, Au; green, Cu-Au; orange, Mo; light blue, REE; light grey, W(-Sn); dark grey, Fe ). Significant lithospheric blocks, defined at sub-crustal depths from multi-disciplinary data, are outlined. Note deposits concentrate along prominent lithospheric structures, particularly in lower-velocity regions or on the flanks of highs, where lower velocities reflect refertilisation of the SCLM and/or higher temperature.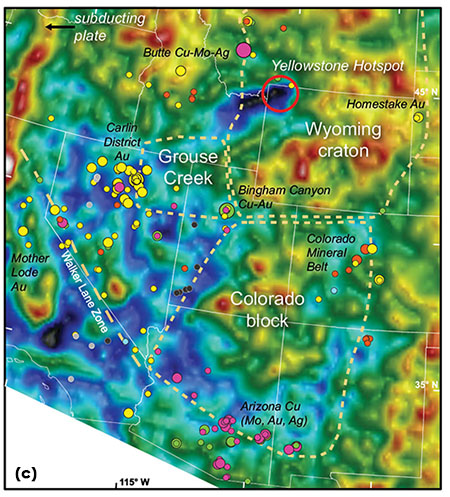
Primary diamond deposits occur in dikes and pipes of kimberlites or lamproites, generated by low-volume melting; they pick up diamonds from the deep SCLM (>150 km) during their eruption. Blocks of cratonic SCLM can now be robustly identified in seismic tomography (e.g. CCFS Publication #334 and references therein) and magnetotelluric (MT) surveys as volumes with high seismic velocity and high electrical resistivity. On the large scale (Fig. 1a), kimberlites are concentrated near the edges of cratonic blocks. High-resolution tomography (Fig. 1b) shows an even more obvious picture; most kimberlites cluster around high-velocity domains in the deep SCLM. These patterns reflect the geochemical requirements for diamond formation, and the structural requirements for magma emplacement. Diamond formation requires the metasomatic introduction of carbon into the depleted SCLM, typically accompanied by Ca, Al, K, Na and Fe, and such refertilised zones have lower seismic velocities.
The weak zones on the margins of cratonic blocks, and in fractures within these blocks, provided channels for the C-bearing fluids, and later controlled the emplacement of the kimberlites.
Major Ni-Cu-(PGE) sulfide deposits are genetically linked to Large Igneous Provinces and komatiites, and the accumulation of metal-rich immiscible sulfide melts in mafic or ultramafic magmas (some likely scavenged from sulfides in lithospheric mantle e.g. Zhang et al., E Sci Rev 2008). The required high-T, low-P melting occurs only in areas of relatively thin lithosphere, and melts access the crust via major faults. This combination of factors is typical of tectonically active craton margins, where most large Ni-Cu-(PGE) deposits are found.
Ultramafic (High-MgO; generally komatiitic to picritic lavas and intrusions) magmas erupt at the surface where plume melting was focused by a transition from thick to thinner SCLM. High-MgO deposits are commonly found in pericratonic basins, which contain the S-rich sediments essential to S-saturation.
Low-MgO mafic (generally gabbro/norite intrusions) systems are also associated with trans-lithospheric faults at cratonic margins, but not with pericratonic basins. They are intrusion-hosted, and occur where magma ascent was hindered by thick crust or a compressive tectonic environment, and melt fractionation and chemical interaction with the lithosphere are enhanced.
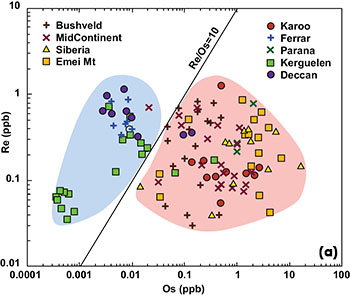
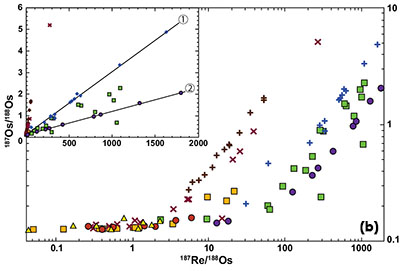
Figure 2. Re-Os data for LIPs and other magmas (a) Re and Os contents of mafic rocks from provinces with known Ni-Cu(-PGE) sulfide deposits (red field) and provinces lacking known deposits (blue field). (After Zhang et al, E. Sci Rev 2008) (b) 187Re/188Os vs 187Os/188Os in flood-basalt suites. Main figure, log-log scale; inset in linear scale. The “isochrons” in the inset correspond to (1) Ferrar dolerites; 65.6±0.3 Ma, intercept 0.12843 (γOs = 1.5±0.3), (2) Deccan Traps; 177±2 Ma, intercept 0.125±0.033 (γOs = -0.6±0.26). Data: CCFS Publication #334, reference [30].
The structural role of the SCLM in focusing magma intrusion is clear, but its compositional role is less obvious. The orthodox view is that the SCLM contributes essentially nothing to magmas, and that most mantle magmas are equally endowed in Ni, Cu and PGEs, so the genesis of an ore deposit simply reflects local factors. However, melt modelling does not explain the high PGE levels in some magmas (e.g. Bushveld Complex), or the provinciality of PGE enrichment in both Ni-Cu-PGE and PGE reef deposits. Interestingly, Large Igneous Provinces and komatiites intruded into areas without (ancient) SCLM roots are not known to contain significant deposits.
“Fertile” (mineralised, continental) flood basalts show a distinctive high-Os signature (Fig. 2a) and our isotopic studies show that these LIPs have interacted with ancient metasomatised SCLM, with high Rb/Sr and low Sm/Nd and Re/Os. Several major LIPs yield Re-Os “isochrons” reflecting their eruption ages, with initial 187Os/188Os below that of the asthenospheric mantle, implying derivation of the Os from older SCLM (Fig. 2b). The SCLM thus may be a critical component in the genesis of Bushveld-type PGE- bearing intrusions.
There is strong evidence that SCLM metasomatised by hydrous melts/fluids above subducting slabs is essential in producing gold-rich (magmatic-) hydrothermal deposits, including Cu-Au porphyries. In seismic images these (and other magma-related) deposits coincide with medium- and lower- velocity SCLM (Fig. 1c). This suggests a model embracing three common features: a mantle source region carrying (Cu-) Au, trans-lithospheric faults, and a tectonic±thermal trigger.
Both the asthenosphere (ca 1ppb Au) and non-refertilised lithospheric mantle are depleted in Au relative to refertilised upper mantle, such as the Lanzo and Ronda peridotite massifs. CCFS research has shown that arc-related mantle near the giant Lihir gold deposit (Melanesia) is metasomatically enriched in Cu and Au, and SCLM xenoliths in China carry up to 14 ppb Au (up to 5 ppm Au in sulfide minerals; see Research Highlight - Mantle's golden secrets sparkle).
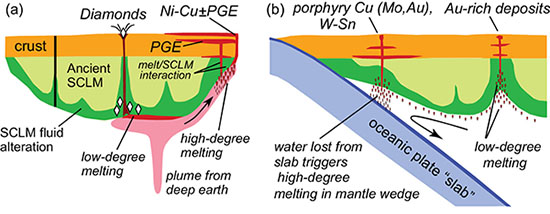
Figure 3. Interactions between magmas and the SCLM. (a) Plume triggers kimberlite formation and flows to area of thinner SCLM where melting is focused. Variable interaction of melts with crust and SCLM influences Ni-Cu and PGE deposit genesis. (b) Generalised convergent-margin setting. Au-poor magmatic-related deposits form from dominantly asthenospheric or crustal melts (e.g. Cu-rich or W-Sn porphyry, respectively). Low-degree melting of asthenosphere, particularly in retro-arc settings, can produce Au-rich metasomatic refertilisation of the SCLM. Subsequent melting (which may be much later) contributes Au to magmatic systems, forming deposits of porphyry Cu-Au, Epithermal Au, Iron Oxide Cu-Au, Intrusive-Related Orogenic Au, and possibly also Carlin-type Au and classic orogenic Au.
Mantle gold enrichment can be related to trapping of low-degree melts; gold behaves as an incompatible element during melting. Even such metasomatised SCLM is relatively durable, and may store (Cu-)Au until a later melting event is triggered.
On balance, the evidence supports an important role for the SCLM in the genesis of some types of major ore deposits (Fig. 3). Lithospheric architecture controls the localisation of some types of ore deposits, and some types of magmas have picked up ore-forming components (e.g. diamonds, gold, PGEs) during their passage through the mantle lithosphere. A lithosphere-scale whole-system approach encompassing asthenospheric to crustal processes, with special attention to the structure, composition (fertility) and evolution of the SCLM, can produce better models for deposit genesis, and help build effective exploration models.

This project is part of all CCFS Themes 1, 2 and 3, Early Earth, Earth Evolution and Earth Today, and contributes to understanding Earth’s Architecture and Fluid Fluxes.
Contacts: Bill Griffin, Graham Begg, Sue O’Reilly
Funded by: CCFS
Youanmi seismic survey a milestone on the quest to unravel the Yilgarn’s past
The Neoarchean Yilgarn Craton and the Proterozoic orogens around its margins are one of Earth’s greatest mineral treasure troves, including iron, gold, copper and nickel deposits. Although the Yilgarn Craton is one of the best studied Archean cratons, its enormous size and limited outcrop make it hard to understand what controls the distribution of these vast resources and which geodynamic processes were involved the tectonic assembly of this part of the Australian continent.
In 2013, significant steps have been taken to address these outstanding questions, including the release of deep seismic reflection and MT surveys over the Youanmi, South Carnarvon, and Yilgarn Craton–Officer Basin–Musgrave Provinces, the holding of a CCFS project definition meeting, targeted field work in several locations in the Yilgarn Craton, and the planning and partial deployment of passive seismic arrays.
Three individual seismic lines (YU1, YU2 and YU3) and complementary magnetotelluric data were acquired across the northern Yilgarn Craton in 2010. Acquisition, processing and interpretation were managed by Geoscience Australia. The lines cross the northern part of the Yilgarn Craton from the Narryer Terrane in the northwest, across major bounding and internal structures of the Youanmi Terrane and into the Kalgoorlie Terrane of the Eastern Goldfields Superterrane. The north-western end of YU1 is east of the southern end of line CP3 from the 2010 Capricorn seismic survey. The two surveys are linked by the Southern Carnarvon (SC) Basin seismic survey, acquired by Geoscience Australia in 2011. The eastern end of YU2 crosses major structures on the western side of the Eastern Goldfields Superterrane that were also imaged by the 2001 Geoscience Australia seismic line (01AGS-NY1), about 120 km to the southeast. The YU, SC and YOM surveys add to the existing network of deep-crustal seismic surveys, and have closed a data gap in the crustal structure of Western Australia, providing a c. 1800 km traverse across almost the entire southern half of Western Australia, from near the west coast to within about 80 km of the border with the Northern Territory.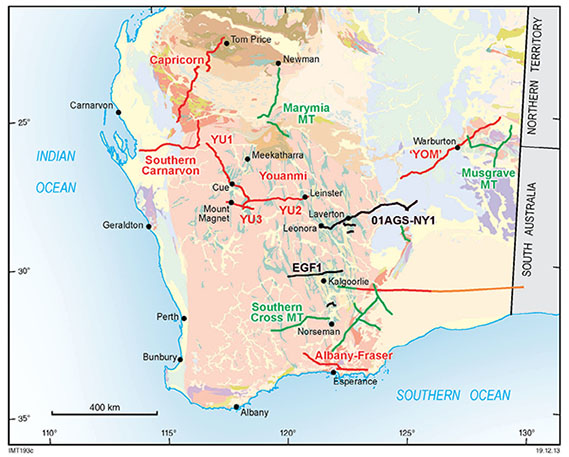
Figure 1. Location of seismic and magnetotelluric surveys funded through the Western Australian Government’s Exploration Incentive Scheme (EIS).
Nd-isotope data suggest that the Youanmi Terrane has behaved as a coherent crustal block since at least 3000–2900 Ma ago. The Youanmi Terrane is bounded by crustal-scale fault zones that dip away from the nucleus, towards the west and northwest on the northwestern side, and towards the east on the eastern side. The accretion of the Eastern Goldfields Superterrane, which may be either an exotic terrane or an extended margin of the Youanmi Terrane, marked the amalgamation of the composite Yilgarn Craton by about 2655 Ma ago. The Narryer Terrane is generally interpreted to have accreted onto the Youanmi Terrane in the northwest, but further work may be required to better define the nature of the Narryer Terrane–Youanmi Terrane boundary.
In the CCFS Project-definition meeting held on 4 July 2013 at GSWA in Perth more than 20 scientists from within CCFS and collaborating institutions contributed to discussions on the direction of collaborative research on the lithospheric evolution and the related significant mineralisation of the Yilgarn Craton and its margins, specifically on geochemistry and geochronology, geodynamics and modelling, and lithosphere imaging.
It was agreed that to improve the geochemical and geochronological map of the Yilgarn Craton, U-Pb, Hf, and Nd isotope studies should be continued in the NE Yilgarn Craton, and extended to the SW Yilgarn Craton. To determine the relative roles of juvenile mantle and continental lithosphere in mafic/ultramafic rocks it was recommended to collect Os and Nd isotope data to develop a mantle-signature database that will supplement ongoing and future crustal isotopic mapping.
As a priority of geodynamics and modelling it was suggested that previously published geodynamic concepts that have been put forward for the Yilgarn Craton should be tested, starting with relatively well-described events such as aspects of the 2800–2600 Ma tectonic evolution in the eastern Yilgarn Craton.
A craton-scale 3D seismic passive-source deployment was proposed to improve lithospheric imaging. Passive-source techniques such as ambient- noise imaging and receiver-function CCP stacking have intermediate resolution in the crust compared with active-source studies, but unprecedented resolution in the cratonic lithosphere.
Figure 2. Outcrop of Meeberrie gneiss in the Narryer Terrane.
The success of the CCFS planning meeting is already evident, as some of the proposed ideas have influenced research proposals, while others have provided direction, focus and context to newly granted projects such as an ARC linkage project granted to the Australian National University and GSWA in 2013. This will fund a three-year passive-array deployment across the south-eastern margin of the Yilgarn. The 2014 deployment of a passive array within the Distal Footprint Science Investment and Education Fund project follows a similar approach for the Capricorn Orogen on the Yilgarn Craton’s northern margin.

This project is part of CCFS Themes 1, 2 and 3, Early Earth, Earth Evolution and Earth Today, and contributes to understanding Earth’s Architecture.
Contacts: Klaus Gessner (GSWA), Ruth Murdie (GSWA), Huaiyu Yuan (Macquarie)
Funded by: CCFS Foundation Project 10a, Western Australian Government’s Royalties for Regions Exploration Incentive Scheme (EIS), Australian Research Council, SIEF
Publication: Youanmi and Southern Carnarvon seismic and magnetotelluric (MT) workshop, February 2013 (preliminary edition) on DigitalPaper: http://geodocs.dmp.wa.gov.au/search.jsp?cabinetId=1101&Combined=N12BF
Global komatiite sulfur dioxide degassing and the irreversible change of the late Archean atmosphere
This study has identified sulfur dioxide degassing from komatiite volcanoes as a single process that explains two major heretofore unrelated conundrums about the Archean earth system: (1) why are komatiite-hosted nickel deposits so well endowed? and; (2) why did the mass-independent record of S isotopes suddenly blossom 200 million years before the Great Oxidation Event? Although in hindsight sulfur dioxide degassing is an obvious process to call on, it has never before been proposed. This is because of disciplinary biases. First, the community studying komatiite-hosted nickel deposits focuses on how metals get into such systems, not how sulfur leaves. Second, the community studying mass-independent S isotopes focuses on sedimentary rocks, where signals are assumed to be larger, rather than igneous ones, where signals are assumed to be negligible. It took a strongly interdisciplinary approach to overcome these biases.
Komatiites are the hottest lavas that ever flowed on Earth. Most komatiite lavas erupted at temperatures of 1400-1600 °C as large submarine lava fields, rising from depths of >100 km in the Archean mantle. Upon emplacement, channelised lava flows and subvolcanic intrusions were sulfide-undersaturated and thermo-mechanically eroded their substrates. Through this process, komatiites incorporated sulfur (S) from volcanogenic exhalative sulfide lenses as well as sulfide-rich sediments that occurred close to volcanic vents, inducing the formation of an immiscible sulfide liquid. Elements such as nickel (Ni), copper (Cu) and the platinum group elements (PGEs) originally present in the komatiite magma strongly concentrated into the immiscible sulfide liquid, due to their high affinity for sulfidic and metallic phases. The progressive accumulation of immiscible sulfide liquid at the bottom of lava channels enabled prolonged partitioning of metals into the sulfide liquid from fresh parcels of komatiite magma, forming sulfide metal concentrations of potentially economic interest. However, this model does not explain the extreme variability in metal contents observed among and within different mineralised komatiites.
In this study we used sulfur isotope measurements on sulfides from komatiites and local volcanogenic and sedimentary country rocks to show that sulfur degassing was a critical component of the volcanic process. Data from variably mineralised komatiite units in the north Eastern Goldfields, Western Australia, indicate pervasive (>90%) sulfur loss from sulfide-saturated komatiite lavas, dominantly in the form of SO2 gas. Rapid sulfur degassing associated with such voluminous and cataclysmic eruptions was most likely a contributing factor for economic mineralisation.
In fact, the total mass of Ni-bearing silicate melt that equilibrates with a sulfide liquid is thought to control the tenor of the resulting nickel-sulfide mineralisation. The high Ni tenors of mineralised komatiites seem to verify this proposal, since geological evidence indicates that large amounts of komatiite magmas interacted with relatively small sulfide reservoirs, leading to estimated silicate-sulfide mass ratios (R factors) of ~100-200. However, ~10- to 100-fold enrichments of Ni, Cu, and PGEs in the sulfide liquid are also a natural consequence of the sulfur loss process identified here. We suggest therefore that variable amounts of sulfur degassing may act in concert with elevated R factors to produce the wide range of nickel tenors observed across different komatiite-hosted nickel deposits.
A degassing sulfur cone.
The observed dramatic bloom in the sulfur mass-independent fractionation (S-MIF) record from sedimentary sulfides at ~2.7 billion years ago appears to reflect enhanced input of volcanic SO2 to the atmosphere. However, the currently proposed volcanic sources of this SO2 do not begin to dominate the global record until ~200 million years later. Our study identifies a new volcanic pulse of sulfur dioxide that fundamentally restructured the Earth's sulfur cycle in the late Archean and provides a solid geologically based hypothesis for the bloom in S-MIF at 2.7 Ga that contrasts with model-based suggestions of changing CH4/O2 ratios at this time. In fact, although komatiite volcanism occurred throughout much of the Archean eon, associated SO2 degassing was probably maximised during the unique peak in komatiite-hosted nickel-sulfide mineralisation at ~2.7 billion years ago. Given the magnitude and brevity of degassing events associated with komatiite volcanism, we suggest that much of the SO2 must have escaped direct sequestration in the marine environment, and, as recorded in the S-MIF archive, fundamentally altered the chemistry of the late Archean atmosphere.

This project is part of CCFS Theme 1, Early Earth, and contributes to understanding Earth’s Fluid Fluxes.
Contact: Marco Fiorentini
Funded by: CCFS Foundation Project 5
The Earth’s thrumming uncovers the northward trek of the Tibetan Plateau
Tibet is a natural Earth laboratory where we can study the dynamics of continental deformation. The growth and maintenance of the enormously thick crust and high topography of this plateau are best explained by the channel flow model, which postulates the existence of a weak layer in the crust beneath the Plateau. Driven by the topographic loading, this weak layer flows to the surrounding areas of the Plateau where the crust is thinner. Geophysical features, including low velocity zones (LVZs) and highly conductive layers in southeastern Tibet, support this model. However, the distribution of LVZs in northern Tibet, which could be used to test the channel flow model, is unknown. 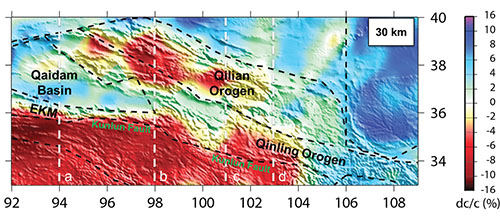
Figure 1. Vsv perturbation map at a depth of 30 km. The dashed lines indicate the four cross sections in Figure 2. EKM: East Kunlun Mountains.
By using ambient noise tomography and probabilistic inversion methods, we have constructed a 3D Vsv model of the north Tibetan crust with a resolution of ~50 km. Our 3D model (Fig. 1, 2) reveals strong LVZs at the middle crust between 20 and 40 km across northern Tibet. The LVZs show significant west-east variations along the Kunlun Fault compared to previous ambient noise tomography. In the western part (Fig. 2 left), LVZs are confined to the regions of the Kunlun Fault and the eastern Kunlun Mountains but are not observed beneath the Qaidam Basin. In the eastern part, beyond the eastern boundary of the Qaidam Basin (Fig. 2 right), LVZs extend and penetrate at least 100 km northward into the east Kunlun and Qinling Orogens. The strong contrast in the distribution of LVZs between the western and eastern parts of the study region mainly results from the distinct tectonic units neighboring northern Tibet. In the west, the strong crust of the Qaidam Basin blocks the penetration of LVZs but the predicted weaker crust in the Qinling Mountains allows the flow of LVZs.
Combined with the observations of strong radial anisotropy in the areas with strong LVZs, the existence of highly conductive layers and the high heat flow in northern Tibet, our Vsv model indicates that crustal channel flow may be occurring in northern Tibet and be responsible for the northward and outward expansion of the Tibetan Plateau. In addition to indicating that crustal flows do exist in northeastern Tibet, the distribution of LVZs from our research also defines the extent of the crustal flow, which is penetrating ~ 100 km beyond the Kunlun fault into the West Qinling Orogen.
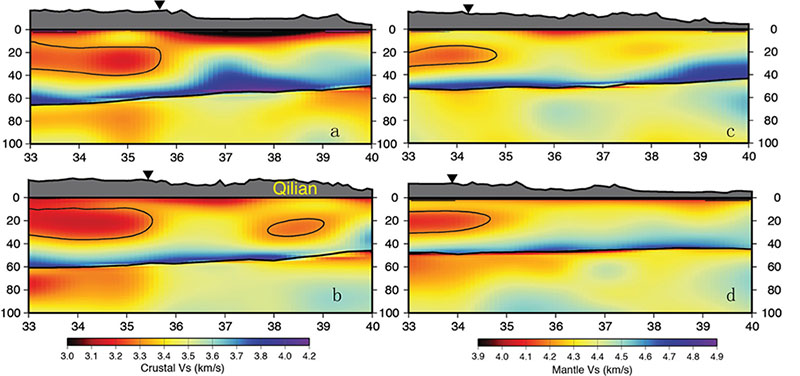
Figure 2. Four cross sections show the distribution of LVZs in north Tibet. All sections are plotted with absolute Vs values.
This project is part of CCFS Theme 3, Earth Today, and contributes to understanding Earth’s Architecture.
Contacts: Chengxin Jiang, Yingjie Yang
Funded by: ARC Discovery Project DP120103673, iMQRES Scholarship
Microbial feasting on the early Earth
Tiny 1,900 million-year-old fossils from rocks around Lake Superior in Canada give the first ever snapshot of organisms eating each other and suggest what the ancient Earth would have smelled like.
While it was once thought that the earliest forms of life were based on photosynthesis from sunlight, much recent work on molecular evolution has shown that the most primitive life forms probably made do without light. Instead of carbon dioxide, such forms are thought to have broken down previously-formed organic matter, in the manner of feeding called ‘heterotrophy’. 
Figure 1. Close up of ~1900 million year old Gunflint chert. The fossils are found in the black zones. Field of view is about 1 m.
It has been more difficult, however, to find ancient fossil evidence for this heterotrophic mode of feeding. Our new research (CCFS publication #321) provides both physical and chemical clues to primitive heterotrophy in the ~1900 million year old Gunflint chert (Fig. 1), from the northern shore of Lake Superior.
We examined microscopic fossils (3-15 μm in diameter) from the Gunflint chert with a battery of high-spatial-resolution techniques including nano-scale secondary ion mass spectrometry (NanoSIMS), transmission electron microscopy (TEM) and focused-ion-beam milling combined with scanning electron microscopy (FIB-SEM). We found that one species of microfossil – a tubular form thought to be the outer sheath of a cyanobacterium called Gunflintia – was more perforated after death than other kinds, consistent with them having been eaten by other bacteria. Indeed, in some places, many of the tiny fossils had been partially or entirely replaced with pyrite (FeS2) resulting from the activities of heterotrophic sulfate-reducing bacteria. We also found that these Gunflintia microfossils carried clusters of even smaller (~1 μm diameter) spherical and rod-shaped bacteria that were seemingly in the process of consuming their hosts (Fig. 2).
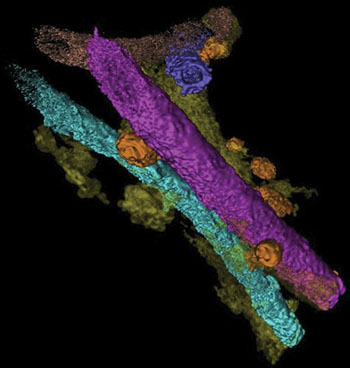
Figure 2. 3D reconstruction of tubular Gunflintia fossils being consumed by heterotrophic bacteria (orange spheres and rod-shapes that are about 1 μm in diameter.
Comparable processes of heterotrophic consumption can still be seen going on today. Indeed they can often be detected by the whiffs they give off – because they give rise to the rotten-egg smell of hydrogen sulfide. Recent geochemical analyses have shown that such sulfur-based activities of bacteria probably can be traced back to 3500 million years or so (as we reported in Nature Geoscience in 2011). While the Gunflint fossils are only about half as old, they confirm that such bacteria were indeed flourishing by 1900 million years ago. This work also shows that they were also highly particular about what they chose to eat, appearing to prefer to snack on Gunflintia as a ‘tasty morsel’ in preference to another bacterium (Huroniospora).
This project is part of CCFS Theme 1, Early Earth, and contributes to understanding Earth’s Fluid Fluxes.
Contacts: David Wacey, Mark Barley
Funded by: CCFS Foundation Project 5
Size matters for ion mobility in deformed Ni-sulfides
Most of the komatiite-hosted sulfide deposits in the Yilgarn craton have experienced some metamorphism and deformation. The signature of such events is well documented for the silicate phases, but what happens in the sulfides is often overlooked. This study focused on the Ni sulfides from three komatiite-hosted deposits: Silver Swan (Black Swan Ni-deposit, Kalgoorlie terrane), Perseverance (Agnew-Wiluna greenstone belt) and Flying Fox (Forrestania greenstone belt). These deposits experienced different degrees of metamorphism and deformation. The Silver Swan ore body recorded the least deformation and reached its peak metamorphic conditions at greenschist facies (Hill et al. Min. Dep. 2004) while Flying Fox, the most deformed, reached its peak metamorphic conditions in upper amphibolite facies (Porter & McKay Econ. Geol, 1981). This study (CCFS Publication #373) characterised the microstructures of three main sulfide phases; pyrrhotite (Fe7S8), pentlandite ((Fe, Ni)9S8) and pyrite (FeS2). Electron backscatter diffraction analysis (ESBD) showed that pyrrhotite is commonly the most deformed phase. In the Silver Swan sample, pyrrhotite develops strain shadows around stronger pyrite, whereas in the Perseverance sample, pyrrhotite shows systematic parallel low-angle boundaries (Fig. 1a, b). In the Flying Fox sample, pyrrhotite contains deformation twins and strain localisation-induced low-angle boundaries (Fig. 2a). Unlike pyrrhotite, microstructures in pyrite and pentlandite are far more uniform. In all three samples, pyrite shows only minor lattice deformation whereas pentlandite locally develops a few low-angle boundaries.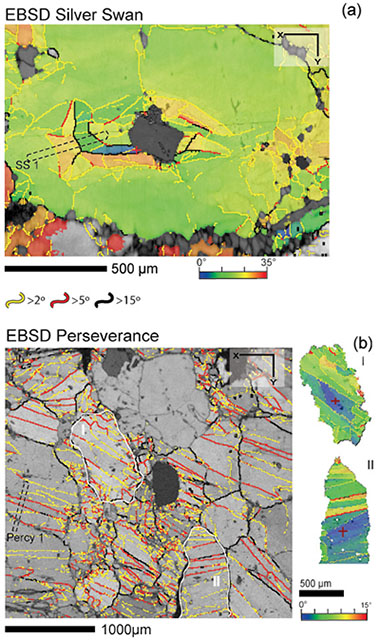
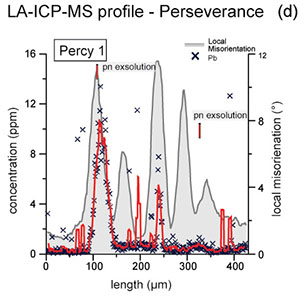
Figure 1. a) Electron backscatter diffraction (EBSD) data of Silver Swan massive sulfide. Band contrast–cumulative misorientation map for the pyrrhotite grain. Black dotted line SS1 shows the position of the ablated area from c). b) EBSD data of Perseverance massive sulfide. Band contrast– grain boundary map for the pyrrhotite grains. Black dotted line Percy 1 shows the position of the element profile from d). EBSD data shown for grains I and II indicate cumulative misorientation from the reference point (red cross). c) Laser ablation ICP-MS Pb profile along line SS1 from Silver Swan pyrrhotite. d) Laser ablation ICP-MS Pb profile along line Percy 1 from Perseverance pyrrhotite. Grey area on both c) and d) corresponds to the maximum local misorientation along the respective profile. Lead is plotted against the length in both c) and d).
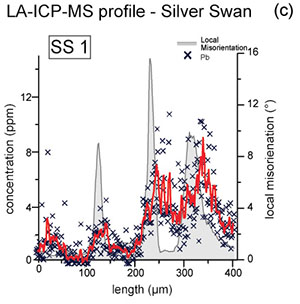
Understanding the sulfide crystal lattice response to deformation leads to another question – are there compositional effects? We used two types of high-precision in situ analytical techniques to determine the trace-element concentrations: laser ablation inductively coupled plasma mass spectrometry (LA-ICP-MS) and Nano-scale secondary ion mass spectrometry (NanoSims). Both trace-element profiles and element maps were acquired using LA-ICP-MS (Fig. 1c, d and 2b-e). The results showed that particular trace-elements with large ionic radii (e.g. Pb) are more concentrated along high and low-angle boundaries as well as along twin boundaries (Fig.1c, d and 2b-e). Unlike Pb, the platinum group elements do not show such variations.
Element mapping with NanoSims has advantages relative to the LA-ICP-MS in terms of scale. Using NanoSims, we mapped an area of 25x25 μm around a twin boundary and detected increased values of Pb (Fig. 2e). It is important to note that these variations are not related to the presence of another phase, but only to the presence of particular dislocation arrays.
Two possible scenarios could explain the correlation between trace-elements and microstructures: 1) late hydrothermal fluid interaction with the sulfide phases and 2) intra-grain diffusion. In the first case, late hydrothermal fluids would play a role in introducing the elements (i.e. Pb) through fluid percolation and mineral–fluid reaction along preferential diffusion pathways such as low angle, grain and deformational twin boundaries. However, the hydrothermal fluid would need to be very similar in chemistry for three deposits hundreds of kilometres apart, so intra-grain diffusion seems the more likely mechanism. Intra-grain diffusion can occur during deformation and post-deformation. During deformation, dislocation cores move to form dislocation arrays. While they are moving, they may encounter large ions (i.e. Pb) and carry them along until they form a particular microstructure. In the case of post-deformation diffusion, intra-granular fluid (already present in the system) acts as a carrier and moves these large ions along high-diffusivity pathways (high and low-angle boundaries, and twin boundaries). At the moment we cannot distinguish between the two intra-grain processes.
Variation in trace elements is observed even in the samples from terrains that experienced metamorphic peak temperatures of no more than 350°C. This implies that the large ions still diffuse at relatively low temperatures. This revelation of strong within-grain trace-element variations, in particular for Pb, has huge implications in Pb geochronology. For more details on this work see CCFS publication #373.
This project is part of CCFS Themes 2 and 3, Earth Evolution and Earth Today, and contributes to understanding Earth’s Fluid Fluxes.
Contacts: Zoja Vukmanovic, Steve Reddy, Marco Fiorentini
Funded by: (in part) CCFS Foundation Project 2
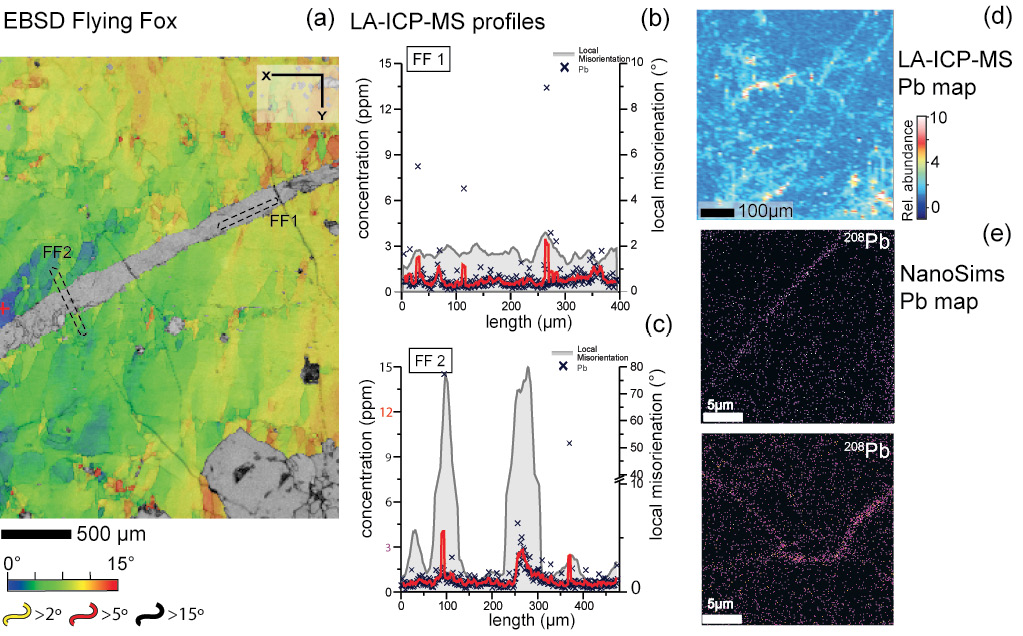
Figure 2. a) Electron backscatter diffraction (EBSD) data for Flying Fox massive sulfide show cumulative misorientation of the pyrrhotite. Black dotted lines show location of the laser profile from b) and c). b) Laser ablation ICP-MS profiles along line FF1 (b) and FF2 (c). Grey area on both b) and c) corresponds to the maximum local misorientation along the respective profile. d) Laser ablation ICP-MS element map for Pb, expressed in relative ppm abundance. e) NanoSims element maps for Pb. For location of the mapped area see CCFS Publication #373.
“Dirty” ice deformation – a peep-show for revealing properties of flowing rocks
Knowledge of the flow characteristics at the microscopic scale (rheological behaviour) of rock masses in the Earths’ crust is essential to the quantitative understanding of plate tectonic processes at the global scale, such as plate movements, mountain building and the break-up of continents. The prediction of rock flow, based on in-depth understanding of the deformation mechanisms in such materials is fundamental to the accuracy of rheological models. Current geodynamic models commonly make the fundamental assumption that the rheology even of polyphase rocks can be approximated by that of a single, monomineralic rock type. However, experiments and field observations show that flow laws from monomineralic materials do not represent the true rheological behaviour of polymineralic rocks. Thus, constraining the rheology of anisotropic and multiphase materials making up the Earth is still a major challenge. Ice mixtures (ice containing another phase) represent such a material, and thus are very good analogues for understanding behaviours of multiphase rocks on Earth.
In nature, a significant percentage of ice is not pure H2O but contains abundant air bubbles, porous hydrate crystals and second phases such as clays and fine grained rock “powder” i.e. “contaminated/dirty” ice. In both instances, these impurities may potentially represent the rheologically softest or hardest material. In nature, such “dirty” layers may govern movement on the large scale.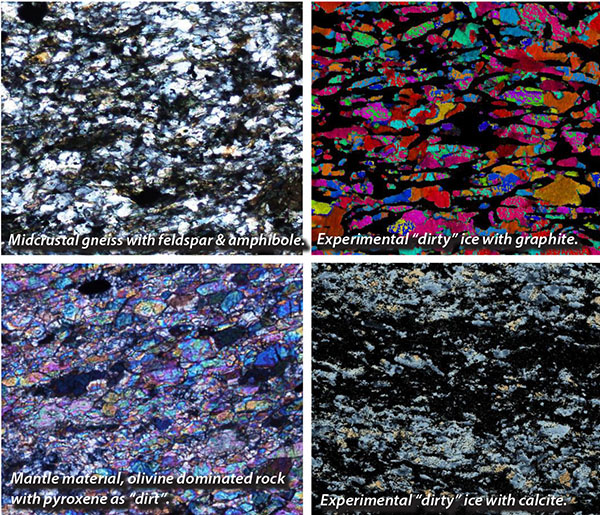
Figure 1. top left; optical photomicrographs of a typical mid-crustal rock - gneiss dominated by feldspar with amphibole as “dirt”. Plane light, (courtesy of R. Gardner); top right; experimentally deformed D2O ice with graphite after 10% deformation, cross polars; lower left; typical mantle material - deformed peridotite with pyroxene, cross polars, (courtesy of R. Gardner): lower right; experimentally deformed ice with calcite after deformation 10%, plane light. Field of view is 1 cm.
This project aims to advance our understanding of anisotropic polycrystalline material with more than one phase by using “dirty ice” for deformation experiments conducted at the Australian Nuclear Science and Technology Organisation (ANSTO). It represents a continuation of the pure-ice deformation work performed previously (Piazolo et al. G3, 2013, CCFS/GEMOC publication number 342/901).
Our international research team chose to use heavy-water ice as D2O provides a unique opportunity to use neutron diffraction analysis to simultaneously monitor the flow properties, microstructure and orientation properties of ice. Laboratory-grown polycrystalline “dirty” ice samples were shortened up to 20%. The results show that the rheology of ice is highly dependent on the nature of the second phases present, their shape, their relative volume and their grain size. A high proportion of second phases may stop ice from recrystallising and little to no crystallographic preferred orientation is produced. The material behaves like a Newtonian fluid with a linear relationship between stress and strain rate. This is markedly different to pure or near-pure ice, which typically shows an exponential relationship. Air bubbles as well as fluid brine significantly soften the material.
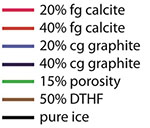
Figure 2. Stress-strain curve for ice with different second phases, (bottom); cg. = coarse grained, fg. = fine-grained, DTHF2 = mixture between ice and gas-hydrate (analogue).
Based on these results, constitutive flow laws are being developed for mixed materials, which will be directly applicable to large-scale modelling of multiphase Earth materials.
This project contributes to the CCFS Goal “to reach a new level of understanding of Earth’s internal dynamics and fluid cycles, and how these have evolved …” as well as CCFS Theme 3, Earth Today, and contributes to understanding Earth’s Architecture.
Contacts: Sandra Piazolo, Daria Czaplinska
Funded by: Bragg Institute, ANSTO, Lucas Heights, ARC DP120102060, FT1101100070
Mantle oddities: sulfate-dominated fluids in the Earth’s mantle
Sulfur is the eleventh most abundant element in the silicate Earth, with an estimated primitive-mantle concentration of 250 ppm. It is a moderately incompatible volatile element that plays a pivotal role in transporting and concentrating chalcophile (= sulfur-loving) metals. In this regard, sulfide melts are enriched in metallic elements and sulfide and bisulfide anions complex with metallic cations dissolved in C–O–H–S fluids. However, the distribution and speciation of sulfur in the mantle remain poorly understood. CCFS Foundation Project 2 has addressed this issue by investigating S-bearing minerals in a global suite of mantle rocks. This has important implications for the formation of melts enriched in S and metals, which are ultimately involved in generating magmatic ore deposits.
In the sub-continental lithospheric mantle (SCLM), sulfur is mainly stored in sulfide minerals in the reduced form S2-. Mantle sulfides may have been deposited by immiscible sulfide melts that separated from silicate and/or carbonate melts at mantle depth, from S-bearing C–O–H fluids, and from sulfidation reactions between S-bearing fluids and silicate minerals. It has also been proposed that some sulfide minerals could be residual after the partial melting events that stabilised the lithospheric roots of continents.
In addition to sulfides, sulfur in the SCLM may also occur in the oxidised form SO42-, in minerals such as apatite and amphibole, albeit in trace amounts. In addition, anhydrite (CaSO4) has been reported as inclusions in diamond, barite (BaSO4) in Cr-diopside from a peridotite xenolith, and alkali-rich sulfates in carbonate-rich inclusions hosted by ilmenite in a mantle polymict breccia. These occurrences attest to the presence of sulfate minerals in the mantle, even at depths within the diamond stability field (> 150 km). ‘Daughter’ crystals of gypsum and barite have been reported in fluid inclusions hosted by mantle olivine, pyroxene and amphibole; this suggests that sulfate (SO3) may be a more common component of some mantle fluids than previously recognised. The occurrence of sulfate compounds in mantle fluids is further supported by mass spectrometric analyses of crushed mantle xenoliths from southeast Australia, which showed the release of SO2 during crushing. Finally, sulfates have been identified in metasomatised rocks from the mantle wedges above subduction zones, which are permeated by sulfate-rich oxidising melts.
Photograph of an off-cut of xenolith sample XM1/498. The off-cut was cut across a layer dominated by K-richterite with minor phlogopite (phl). The layer is pervasively cross-cut by creamy-coloured sulfate-rich veins (from Giuliani et al., 2013).
Sulfates can crystallise from a range of chemically different fluids and are common constituents of carbonatitic rocks. Anhydrite has been shown to crystallise from silicate magmas of intermediate to acid composition. Strontium-rich barite and less commonly alkali-sulfate minerals occur in the groundmass of kimberlites. Celestine (SrSO4) and aphthitalite [(K, Na)3Na(SO4)2] have been found in melt inclusions hosted by kimberlitic olivine. Barite is a minor constituent of vein assemblages in mantle MARID (mica-amphibole-rutile-ilmenite-diopside) rocks and may have crystallised from kimberlite-related fluids.
There is also evidence for the occurrence of sulfate-bearing fluids in crustal rocks and documentation of sulfate melts from experimental simulations. However, despite increasing evidence for the occurrence of sulfate melts in crustal rocks, such fluids have never been documented in mantle rocks. Now, the occurrence of Ba-bearing celestine veins that also host abundant clinopyroxene and minor sphene, apatite, pectolite, phlogopite, barite and carbonates, in a mantle MARID xenolith sampled by the Bultfontein kimberlite (Kimberley, South Africa) has been documented (CCFS publication #333). On the basis of textures, mineral inclusions and mineral chemistry, and data for Sr and S isotopes in celestine and the other minerals in sulfate veins and the host MARID minerals, we suggest that the sulfate-rich veins were produced in the mantle from interaction between a sulfate-rich fluid and the MARID host rock. These celestine-bearing veins provide the first evidence for the occurrence of sulfate-dominated fluids in the Earth’s mantle.
This project is part of CCFS Theme 3, Earth Today, and contributes to understanding Earth’s Fluid Fluxes.
Contact: Marco Fiorentini
Funded by: CCFS Foundation Project 2a
The riddle of the origins of zircon in ophiolitic rocks: a case history from the Coolac Serpentinite Belt, southeastern Australia
An increasing number of studies are reporting U-Pb ages for zircons recovered from rocks of the mantle sections of the ophiolitic complexes and host peridotites. Were these zircons crystallised in the mantle from percolating metasomatic fluids or are they xenocrystic relics of crustal material recycled during subduction? What they mean in the framework of ophiolite and exhumed mantle rock genesis and evolution is controversial. The deciphering of this complexity requires integrated datasets that are not confined to zircon U-Pb data alone. Equally importantly, these data are integrated within a comprehensive geological framework. Our study of zircons from the Coolac Serpentinite Belt in southeastern Australia sends a cautionary message to the researchers who use ophiolitic zircon to unravel the past geodynamics of Earth's lithosphere and mantle.
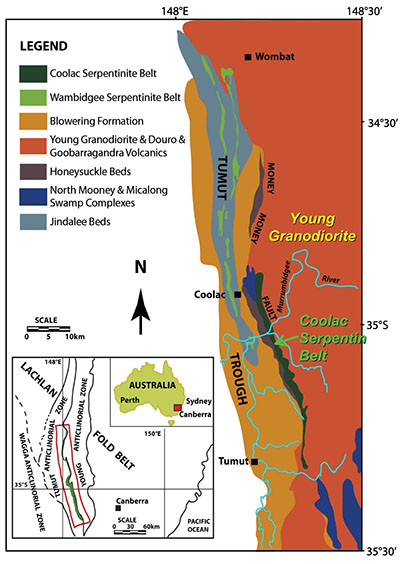
Figure 1. Map shows the location of the Tumut region within the Lachlan Fold Belt: the Coolac Serpentinite Belt (dark green) separates the Tumut and Young zones (after Graham et al., Geology, 24, 1996).
The Coolac Serpentinite Belt (CSB) is part of the Tumut ophiolitic complex in the Lachlan Fold Belt, southeastern Australia (Fig. 1). The 63 km belt contains a high proportion of massive (unfoliated) ultramafic rocks that have undergone lower greenschist-facies metamorphism (e.g. Graham et al., Geology, 24, 1996). New U-Pb, Hf- and O-isotope, and trace-element data have been obtained for zircons from the rocks of the belt. These include zircons separated from two (high-Al and high-Cr) massive chromitites and rodingites in the Coolac Belt, and from detrital zircon grains recovered from gullies draining from outcrops consisting of mainly weakly serpentinised massive porphyroclastic harzburgite. The Belt is either faulted against, or intruded by, the S-type Young Granodiorite. Zircons from the Young granodiorite collected at the contact with the serpentinite belt were also studied to refine the tectonic relation and timing of the granitic magmatism.
The U-Pb age of the zircons from this serpentinite belt display a wide range, from Silurian to Paleo-Proterozoic, with the main age population clustering around 430 Ma (Fig. 2A). This main peak coincides, within analytical error, with the age obtained for plagiogranites from the Belt and with the age of the Young Granodiorite intrusion (427.6 ± 3.2 Ma). Moreover, the ages for the inherited zircon populations in the granodiorite correlate well with the older zircon populations from the Coolac ultramafic rocks (Fig. 2B).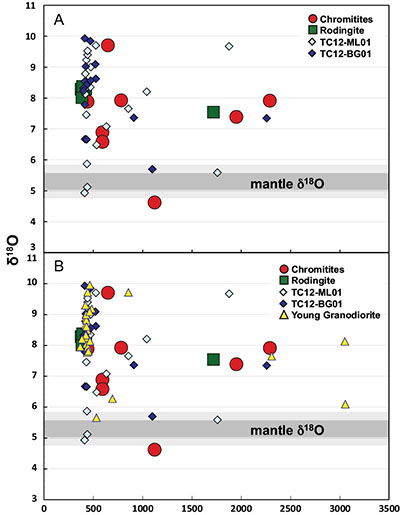
Figure 2. Plots of δ18O versus U-Pb age in zircons from the Coolac Serpentinite Belt, including detrital ‘TC’ TerraneChron® (A) and comparison of those with zircon from the Young Granodiorite (B). The mantle values of 5.3‰ (Valley, 2003) are shown with 1σ and 2σ deviations as dark and light bands accordingly.
Most of the Coolac zircons have negative εHf and heavy (>6) δ18O indicative of a crustal origin. Combined with U-Pb age information, this implies that the zircons in the peridotites are xenocrystic (Fig. 2). One possibility is that zircons derived from subducted sediments were incorporated into the ophiolitic rocks as in the Luobusa (Tibet) ophiolite (Yamamoto et al., Island Arc, 22, 2013). However, the similarity of the Coolac ophiolite-derived zircons with those from the Young Granodiorite may indicate that they were introduced into the Coolac peridotitic complex during the time of voluminous granitic magmatism that occurred in the region at ca 430 Ma ago. In the latter case, zircons carry no information on the origin of the Tumut ophiolitic rocks and only suggest that Coolac rocks had preceded granitic magmatism of the Lachlan Fold Belt.
Thus, our observations highlight that the collection of integrated information on zircons is critical for the adequate interpretation of the timing of the ultramafic rock formation, emplacement and subsequent tectonic implications in the context of regional geology. In cases of xenocrystic zircons, a clear understanding of their origin and relationships with the host ophiolitic rock would improve the probability of geological meaningful interpretation about the generation of ophiolites, and the subsequent dynamics of mantle-crustal interaction.
This project is part of CCFS Themes 2 and 3, Earth Evolution and Earth Today, and contributes to understanding Earth Architecture and Fluid Fluxes.
Contacts: Elena Belousova, José María González Jiménez, Bill Griffin, Sue O’Reilly, Norman Pearson
Funded by: ARC Future Fellowship, Macquarie University contribution to ARC FF and CCFS TARDIS
Metals flow in mantle streams
The capacity of aqueous fluids to selectively extract metals and incompatible elements from the Earth’s mantle and thereby enrich its crust and lithosphere has long been inferred, but has been a challenging problem to investigate experimentally. By adopting an inverse approach, we have avoided many previously encountered difficulties and obtained detailed experimental data on the capacity of aqueous mantle fluids to transport a broad range of incompatible elements and metals. Rather than directly equilibrating water with mantle peridotite, we used a previously studied basanite as a proxy for a H2O-saturated solidus melt (of peridotite) and determined the compositions of H2O-rich fluids in equilibrium with the basanitic melt. The experimental conditions were 950-1200 °C and 1.0 to 4.0 GPa. In this way we were able to use mineral/melt partitioning data for the basanite to infer fluid/mineral partitioning for peridotite minerals. Our results were confirmed by one experiment in which we directly equilibrated an H2O-fluid with a mica-amphibole-lherzolite assemblage. 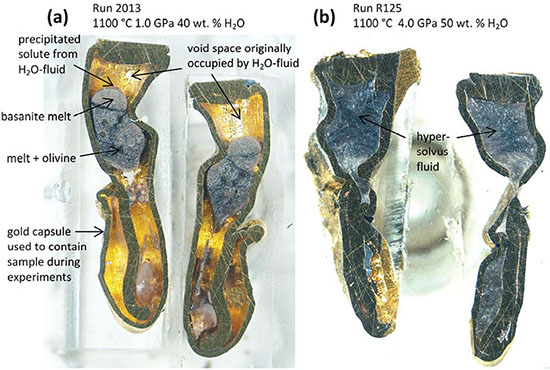
Figure 1. Longitudinal sections of sample capsules after experiments
At the lowest pressure and temperatures investigated (1.0 GPa, 950-1100 °C) H2O-fluids have a limited capacity to transport most incompatible elements and metals (Figs. 1a, 2). But as pressure and temperature increase, the solubility of silicates and metals in H2O-fluids increases dramatically. By 4.0 GPa there is complete miscibility between the H2O-rich fluid and silicate melt (Fig. 1b). Relative to coexisting melts, the H2O-rich fluids are enriched in silica, alkalis, Ba and Pb, and depleted in FeO, MgO, CaO and rare earth elements. Surprisingly they are not especially depleted in high-field-strength elements (Nb, Ta, Zr, Hf and Ti). These features are consistent with currently accepted ideas about the role of both H2O-rich fluids and rutile in the development of arc magmas. They are also consistent with a role for H2O-rich fluids in the development of incompatible-element enrichments in some samples of the deep mantle lithosphere as well as the lamproite magmas that bring such samples to the surface.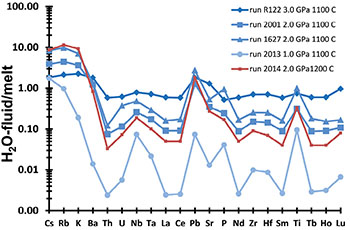
Figure 2. Partitioning of incompatible elements between H2O-fluids and silicate melts
This project is part of CCFS Theme 3, Earth Today, and contributes to understanding Earth’s Fluid Fluxes.
Contacts: John Adam, Tracy Rushmer, Marek Locmelis, Marco Fiorentini
Funded by: ARC CCFS
Supercontinent breakup clues in Yilgarn mafic dykes
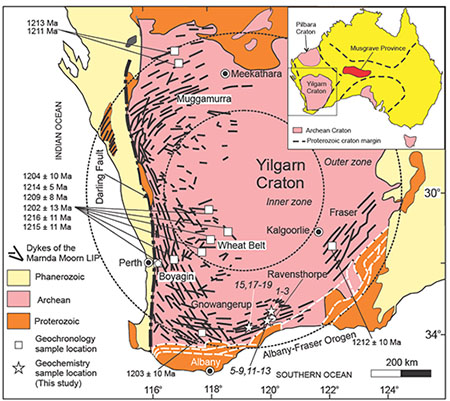
Figure 1. Simplified geology of the Marnda Moorn large igneous province. Thick black lines indicate general dyke trends. The inset map shows the location of the Musgrave Province, where ultrahigh-temperature events occurred at c. 1.21 Ga.
The 1.21 Ga Marnda Moorn large igneous province (LIP) in the Yilgarn Craton (Fig. 1) recorded the final breakup of the Nuna (Columbia) supercontinent (see Research Highlight in CCFS 2012 Annual Report ). However, its petrogenesis has been poorly understood owing to the lack of geochemical data. Now, geochemical analyses of the Gnowangerup-Fraser Dyke Suite, a major part of the Marnda Moorn LIP, have begun to fill this gap (CCFS publication #371). The dykes are predominately tholeiitic and OIB-like dolerite (Type-1, high Ti), but there is one arc-like and more felsic dyke (Type-2, low-Ti) (Fig. 2). Type 1 samples have incompatible-trace-element compositions similar to those of tholeiitic Hawaiian plume-induced OIB and typical asthenospheric mantle-derived Nd isotopes with εNd(t) varying from +3.7 to +7.5, produced mainly within the spinel stability field (shallower than 75 km). Their source region most probably contains recycled oceanic crust. Samples from the Type 2 dyke have extremely unradiogenic Nd with εNd(t) of about -12, strong depletion of Nb-Ta-Zr-Hf-Ti, chondritic Nb/Ta ratios of 18–20, oversaturated silica, and strong deficiencies in CaO, FeOt, TiO2, and Ni. This implies that the dyke was produced by partial melting of enriched sub-continental lithospheric mantle. The coexistence of OIB- and arc-like end-members but mainly Hawaiian OIB-like tholeiitic mafic dykes is interpreted to reflect large-scale asthenosphere upwelling in a very short time.
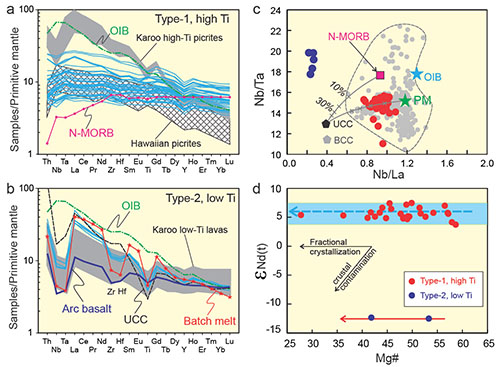
Figure 2. Primitive mantle-normalised incompatible trace-element distribution patterns (a and b) and plots of (c) Nb/Ta versus Nb/La and (d) Nd isotopes against Mg# for the samples of the Gnowangerup–Fraser Dyke Suite from the Marnda Moorn large igneous province.
The geochemical and emplacement characteristics are attributed to relief of the lithosphere–asthenosphere boundary across the Yilgarn craton and a complex interplay between the plume, a heated lithosphere, normal asthenosphere, and recycled components. A two-stage melting model can explain the geochemical composition and emplacement of the Marnda Moorn LIP. This involves a mantle plume impinging on the base of the continental lithosphere beneath the Yilgarn craton at about 1.21 Ga. During the first stage, the root of the Yilgarn Craton would have deflected plume materials away from its centre in lateral flows, to pond beneath the cratonic margin. Heat from the underlying plume would enhance partial melting of enriched components of the SCLM to generate Type 2 dykes. At this stage, the recycled oceanic crust (pyroxenite and/or eclogite) would be extensively partially melted, further enhancing lateral flow of the plume materials and leading to significant erosion and destruction of the SCLM. The main phase of the Marnda Moorn LIP (OIB-type tholeiitic mafic rocks) was produced during the second stage by partial melting of ponded plume materials and newly formed pyroxenites, within the spinel stability field. Our plume-lithosphere interaction model is consistent with the occurrence of synchronous ultrahigh-temperature events in the Musgrave Province of central Australia and the large volume of mafic magma in the Marnda Moorn LIP.
This project is part of CCFS Theme 2, Earth Evolution, and contributes to understanding Earth’s Architecture and Fluid Fluxes.
Contacts: Xuan-Ce Wang, Zheng-Xiang Li, Sergei Pisarevsky, Michael Wingate
Funded by: CCFS, CCFS ARC ECSTAR fund
Zircon: a prime witness to the Moon’s early history
The first five hundred million years of Earth’s history have seen most of the events that shaped it to its present form, such as differentiation into the core, mantle and crust and the formation of the atmosphere and hydrosphere. Unfortunately the later tectonic and hydrologic modifications of our planet have erased most records of these early events. The very early history of Earth is now only preserved in tiny zircon grains that survived the ca four billion years following their formation. However, due to their rarity and size they can provide only a glimpse of the early conditions on our planet. In contrast, the Moon was only geologically active for only about 1.3 billion years after its formation; the most recent basalt is about 3.2 billion years old. Therefore lunar rocks can reveal the early history of both Moon and Earth.
As on Earth, lunar zircon can be used for Uranium-Lead (U-Pb) dating, to give a timeline of early events in the differentiation of the Moon. In addition, zircon is chemically and physically robust: it can also survive meteoritic impacts and hence provide useful insight into the bombardment history of the early solar system. Our research focuses on deciphering both magmatic and impact features within tiny zircon grains to understand how these features affect their crystallography and chemistry and whether they can be used to date specific magmatic and impact events.
Since its formation, the Moon has been bombarded by countless meteorites, so that the lunar surface consists of a thick regolith covering the magmatic basement. Lunar zircons are found in impact breccias: mixtures of different rock and mineral fragments (clasts) welded together by impact-generated melts. Some zircon grains fortunately are found within their original magmatic rocks, which occur as minute clasts (up to a few centimetres) in the breccia. Lunar zircons can be classified into groups based on (i) their textural relationships with surrounding minerals in the host breccias, (ii) their internal microstructures as identified by small scale imaging and (iii) their U-Pb isotope systems as analysed in-situ by ion microprobe. Primary zircon has a magmatic origin and is unzoned or has sector and/or oscillatory zoning as identified in cathodoluminescence images. Its U-Pb age is concordant and consistent across its polished surface. Secondary zircon formed during an impact and usually shows internal structures overprinting primary features. Recrystallised or amorphous domains often yield internally consistent and close to concordant U-Pb ages that can be interpreted as dating impact events. Crystal-plastic deformation, planar deformation features and fractures, however, provide channels for Pb diffusion and result in partial resetting of the U-Pb isotopic systems. 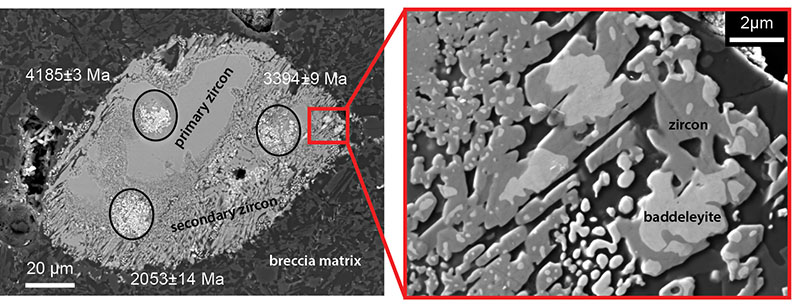
Left, is a back-scattered image of zircon from Apollo 15 breccia – circles indicate location of U-Pb analyses, with corresponding ages (Ma = million years). Right, a magnified view showing the relationships between zircon and baddeleyite in the zircon rim.
A particular zircon with a complex structure was identified in one impact breccia sampled during the Apollo 15 mission. It has primary features preserved in its inner part while its outer rim has been transformed under high pressure and temperature during an impact. The inner part of the grain is crystalline and undeformed. The outer rim of the zircon is made of small zircon and baddeleyite (zirconium oxide) grains, formed by the breakdown of zircon [zirconium silicate] to baddeleyite and silica at pressures above 60 GPa and temperatures close to 1700°C, during impact. The age obtained for the primary inner core of the grain, although discordant, is in agreement with the age of other primary zircon grains from the same sample, at 4.33 billion years. This represents the age at which the zircon crystallised from a magma. The two other ages obtained on the outer rim of the grain are much younger and consistent with an impact that occurred 1.94 billion years ago. This zircon grain demonstrates that very small-scale microscopic imaging and precise in situ ion-probe dating can provide a wealth of information on the overall history of the Moon, and hence the Earth (see CCFS Publications #374, 423 ).
This project is part of CCFS Theme 1, Early Earth, and contributes to understanding Earth’s Architecture and Fluid Fluxes.
Contacts: Alexander Nemchin and Marion Grange
Funded by: CCFS, ARC Discovery Project #120102457 (Nemchin-Grange)
Detecting diamond distillation of nitrogen – frontiers of quantifying nitrogen mantle behaviour
Nitrogen is the most common impurity in diamonds, and the properties of nitrogen in the diamond lattice are an important part of standard diamond classification. Traditionally, the isotopic characteristics of this nitrogen have been analysed by bulk combustion methods. When modern in situ methods (secondary ion mass spectrometry, or SIMS) were first applied to carbon-isotope analysis of diamonds, it became obvious that bulk analysis is of limited value as it provides an averaged value, hiding the real variations in C-isotope composition that can be present in a single diamond. This is unfortunate, because these variations carry very interesting stories about the origins and growth histories of diamonds; we could expect similar revelations from in situ analysis of N isotopes in diamonds. However, until recently SIMS analysis of nitrogen isotopes in diamond has faced large uncertainties due to issues with the methodology and the need for isotopically homogeneous reference material.
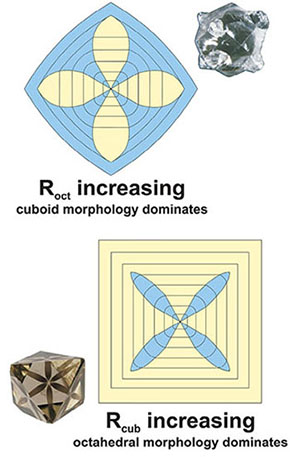
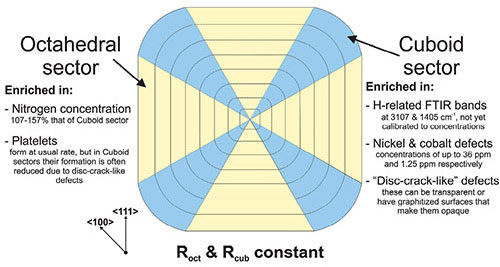
Figure 1. (a) Schematic illustration of a mixed-habit diamond, with the octahedral growth sectors in yellow, and the cuboid growth sectors in blue, when the growth rate (R) of each sector is equal. Arrows show the cube <100> and octahedral <111> axes. Information is provided regarding how impurities are distributed between the two sectors (left column octahedral sectors, right column cuboid sectors). Images (b) and (c) show examples of when the growth rate of one sector increases relative to the other. Inset are images of natural examples of these (courtesy of Tappert et.al. 2011 and G.M. Pearson).
There have been two principal goals of this research (part of Foundation Project 8) that has the overarching goal of understanding the nature of deep Earth fluids. The first was the development of a suitable standard reference material for carbon and nitrogen isotopic analysis of diamond via SIMS in collaboration with Dr Richard Stern and Professor Thomas Stachel of the Canadian Centre for Isotopic Microanalysis (CCIM) at the University of Alberta. The CCIM is leading SIMS analysis of diamonds, and this expertise and knowledge is being used to establish such methodologies at the CCFS SIMS (CMCA) facility in UWA (see Technology Development section). The second goal of this work is to investigate the relationship between the nitrogen isotope systematics and the crystal growth mechanisms of diamond. In particular, we want to look at the relationship of these two and what roles they play in the growth of mixed-habit diamonds. This type of diamond has been the focus of some of the diamond research being carried out at CCFS (CCFS publications #178, 180, 332). They are unique crystals that exhibit periods of growth in which two competing growth mechanisms were occurring at the same time. These two growth mechanisms produce the characteristic smooth, flat octahedral growth, and the hummocky, rough cuboid growth (Fig. 1).
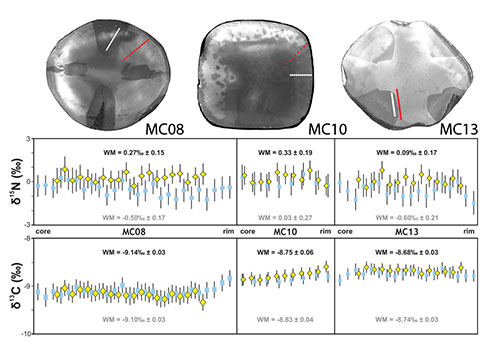
Figure 2. CL images of the three samples analysed by SIMS, showing where the data were collected. Red and white dots show analyses in the cuboid and octahedral sectors respectively. Each transect was repeated but slightly offset to obtain both C and N isotopic analyses. The data from both transects (Yellow diamonds = octahedral data, Blue squares cuboid data) are shown on the same graph, along with the weighted mean value (WM), to allow for easy sector comparison.
SIMS analysis of three previously-studied mixed-habit diamonds at the CCIM has shown that on the millimetre scale, the samples are homogeneous in terms of their carbon and nitrogen isotopes (Fig. 2). They therefore represent ideal standard reference materials for this type of analysis. The methodology that has been developed produces data with 2σ uncertainties of ~ ± 0.7 ‰ for δ15N measurements. This is much better than the uncertainties of ± 8 ‰ that have been reported for δ15N data from SIMS by other researchers in the past. Interestingly for the investigation of mixed-habit growth, all three samples show slightly elevated δ15N values in the octahedral sectors compared to the cuboid ones (although this is only above uncertainty in two of the samples). This small fractionation is in stark contrast to that seen in synthetic diamonds, where the cube sectors have are δ15N values that are 30 ‰ higher than the octahedral sectors. This work is showing an understanding of the growth mechanisms involved as well as the underlying crystallography is essential to interpreting and drawing conclusions from such commonly used data. Understanding isotopic distribution and possible fractionation is a first step in understanding the origin and significance of nitrogen in the mantle, especially the relative contributions from recycled and primordial sources.
This project is part of CCFS Themes 2 and 3, Earth Evolution and Earth Today, and contributes to understanding Earth’s Fluid Fluxes.
Contacts: Dan Howell, John Cliff, Bill Griffin
Funded by: CCFS Foundation Project 8
Stretching, pushing or something else: A memory fragment in a continent lithosphere recalls its tectonic history
A link between the deformation of the upper mantle rocks and the directional dependence (anisotropy) of seismic wave speed is one of the mainstays of the modern structural seismology toolkit. It provides a means to “see” processes at depth that are suggested by observations of plate motion, by differences in absolute wave speed inferred from tomography, and by scenarios of past tectonic evolution. However, interpretations of seismic anisotropy beneath continents are challenging, because the peridotites that make up both the lithospheric mantle and the asthenosphere beneath it are likely to become anisotropic under strain. The early debates over where the anisotropy resides, and whether it reflects present or past deformation (Fig. 1), have been largely settled by the recognition that both volumes of olivine-rich rock will likely have systematic texture imparted onto them by past tectonic events and/or current plate motion, or both. 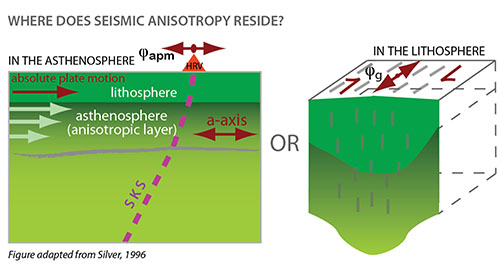
Figure 1. Vertical variation of anisotropy in the shallow upper mantle. If anisotropic properties are restricted to a single layer (either frozen into the lithosphere or formed in the asthenosphere by current mantle flow), we can use observed polarisation of split shear waves as a representation of the past deformation (in the lithosphere) or current deformation (in the asthenosphere). φapm and φg: apparent fast axis directions inferred from SKS.
We have developed high-quality constraints on the vertical and lateral variation in anisotropy at three locations in eastern North America (NA), which we could then compare with structure predicted for this region by the large-scale NA surface wave model of Yuan and Romanowicz (Nature, 466, 2010). We use a combination of two complementary techniques, an anisotropy-aware receiver functions (RF) analysis and an inversion for multiple layers of anisotropy on the basis of directionally variable shear-wave. Compared with the regional surface-wave model, these two methods are capable of resolving anisotropy structure at the station scale. The combination of these two techniques is complementary because P-S mode conversion is primarily sensitive to vertical gradients in properties while birefringence in SKS phases is an integral measure of anisotropic properties along their near-vertical paths (Fig. 2).
Our findings are summarised in Figure 3, focusing on anisotropic symmetry axes predicted by SKS and RF observations at three stations, and fast axis directions predicted for the lithosphere and the asthenosphere in the surface wave continent-scale model. On the basis of the close agreement we see in the orientations of fast directions at different depths, we define two distinct anisotropic layers in the upper mantle: an upper lithospheric layer with a fast direction ~120° SE (Fig. 3a) and an asthenospheric layer with a fast direction ~50° NE (Fig. 3b). This is especially pronounced in the strength of anisotropy predicted in the lithospheric part of the YR2010 model, which becomes progressively smaller inward from the coast. Nevertheless, the differences between these two layers are significantly stronger than the internal variation within each.
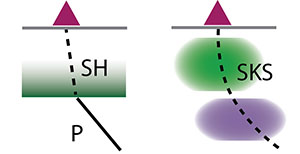
Figure 2. Depth sensitivity illustrated for receiver function analysis (left) and SKS modeling (right). Dashed lines indicated the shear wave (P-SH and SKS) paths. Preferred anisotropy depth distribution (shaded) is inferred from this study.
The close alignment of fast directions in the asthenosphere with the absolute plate motion (APM) vectors was anticipated.
In eastern NA our observation favours the APM directions. Their apparent directional mis-match with the predictions of the YR2010 model or the APM direction is attributed to relatively small-scale lateral variation in upper mantle velocity (Fig. 3c).
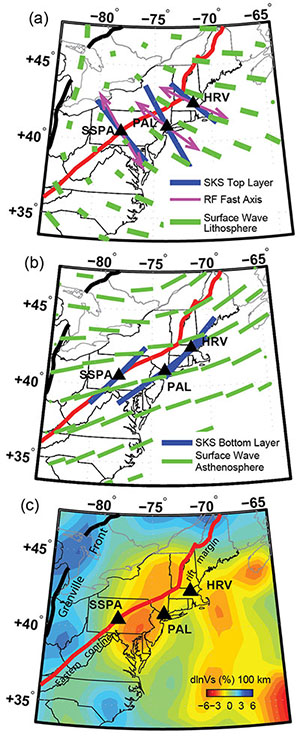
Figure 3. Map view showing the two-layer modeling results for the top layer (a) and bottom layer (b). The lithosphere anisotropy direction inferred from transverse receiver functions is also plotted as arrows in (a). Green sticks in (a) and (b) are equivalent two-layer (lithosphere and asthenosphere) model predicted from the 3D azimuthal anisotropy model of YR2010 model, maximum 1 s in the bottom layer). (c) Vs variation from Yuan et al. EPSL 2013 (http://dx.doi.org/10.1016/j.epsl.2013.11.057).
On the other hand, the inferred fast axis direction in the lithosphere is at a high angle to the strike of major tectonic units in the Appalachians, and is nearly identical over a broad region. This suggests that a regional deformation event affected a large area of the present-day northern Appalachians.
Several possible tectonic episodes in North America’s history could have imparted the NW-SE oriented fabric to its mantle lithosphere. Deformation related to the assembly of the Appalachians from a set of terranes is not a plausible candidate. Numerous studies note near-parallel directions of tectonic units in compressive (“pushing”) orogens and the fast direction of anisotropy, and have argued for orogen-parallel flow. Similarly, it is difficult to relate the broadly distributed sub-horizontal deformation to the rifting (“stretching”) of the Atlantic, which was highly focused in the area presently offshore.
A scenario (“something else”) that may explain the observed lithospheric anisotropy would involve the loss, on a regional scale, of the lower part of the lithosphere. This episode has to occur after the assembly of the Appalachians, to impact all the terranes involved. We considered a possibility of viscous instability that would lead to the development of “stretch marks” in the depth range where the lithosphere detaches. Given the broad areal extent of the lithospheric fabric, we believe that a “delamination” sensu stricto may be more probable.
The technique designed (Yuan and Levin, JGR submitted) serves as a toolkit that can be easily applied to Western Australia, which will pin-point the anisotropic lithospheric structure beneath local stations, complementary to a large-scale 3D tomographic inversion that is currently under development.
This project is part of CCFS Themes 2 and 3, Earth Evolution and Earth Today, and contributes to understanding Earth’s Architecture and Fluid Fluxes.
Contact: Huaiyu Yuan
Funded by: CCFS foundation project 10a, 3D Architecture of the western Yilgarn Craton
Mantle’s golden secrets sparkle
The upper mantle (convecting and lithospheric) plays an important role in the formation of major metallic ore deposits (e.g. Ni, Cr, diamonds; CCFS publication #207 ). However, the role of the mantle in the genesis of gold deposits is poorly defined and still widely debated. This is primarily because the ultra-low concentrations of gold in mantle rocks are very difficult to analyse.
The state-of-the-art instrumentation at CCFS has allowed us to tackle this problem from a new perspective. We have analysed the sulfide minerals, which naturally concentrate gold, in several suites of mantle peridotite (olivine-rich) xenoliths. These data can then be combined with the well-characterised alteration history of the samples to develop a model for how gold concentrations are modified during mantle processes. We also have compiled a large database of whole-rock gold analyses in mantle samples from the literature to compare with our analyses.
Our data indicate that gold concentration in the upper mantle is very heterogeneous. This is confirmed by a meta-analysis of the literature data. This heterogeneity is present on fractal scales. Using our techniques, we can observe it between grains hosted in a single sample, but it also occurs between samples from a single suite, and between localities globally.
The variation in gold contents shows a strong relationship with the degree of metasomatism the sample has experienced, as defined by rare earth element (REE) characteristics (Fig. 1). This relationship holds true using both our in situ analyses and in the compiled whole-rock dataset. The samples that show the least interaction with metasomatic agents (i.e. the samples with the lowest La/Yb ratios) have the greatest heterogeneity in the Au content, both among their individual sulfide grains and between xenoliths. Conversely, the samples that show strong interaction with metasomatic agents (i.e. samples with high La/Yb ratios) have relatively homogeneous gold contents among their individual sulfide grains as well as between samples. These strongly modified samples also typically have the lowest gold concentrations.
This homogenisation and reduction of gold concentrations during metasomatism indicates that the samples that have experienced a high fluid flux have fully re-equilibrated with the metasomatic agent. During this process, gold has partitioned into the fluid phase and been partially removed from the system, resulting in overall lower gold concentrations. On the other hand, small fluid fluxes may introduce new sulfides into the samples but leave the previous generation of sulfides unmodified. As a result these “unmetasomatised” samples contain both residual and metasomatic sulfides.
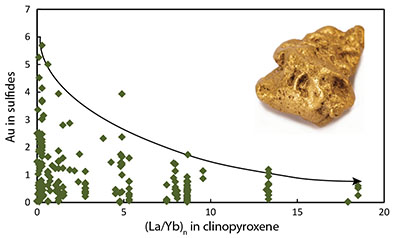
Figure 1. Au content in sulfides versus (La/Yb)n in coexisting clinopyroxene. Higher La/Yb ratios in clinopyroxene is indicative of a greater fluid flux. The samples that have experienced the greatest interaction with fluids have the lowest and the most homogenous gold contents.
These results have several major implications. Firstly, it indicates that gold is likely to be removed rather than added during major metasomatic modifications of the upper mantle. Contrary to what has previously been suggested, it is unlikely that there are regions of “gold-rich” metasomatised upper mantle.
Secondly, the heterogeneity of the sulfide phase in the otherwise “unmetasomatised” samples has implications for Os-isotope studies. Many previous studies have used whole-rock analytical techniques to determine the age of depletion of mantle samples. To exclude the effects of metasomatism, these studies often look at the REE characteristics of the samples and pick those that are “unmetasomatised”. This study shows that these are the samples that are likely to have the greatest mixture of sulfide generations, and thus whole-rock techniques will not give a reliable age of depletion.
This project is part of CCFS Themes 2 and 3, Earth Evolution and Earth Today, and contributes to understanding Earth’s Fluid Fluxes.
Contacts: Ed Saunders, Norman Pearson, Sue O’Reilly, Bill Griffin
Funded by: ARC CoE CCFS Foundation Project 1 (TARDIS); APA, MQPGRF
How “super” was Nuna?
There has been a growing interest in the proposed pre-Rodinian supercontinent, variously called Nuna, Columbia, or Hudsonland. One of the main geological arguments used for this hypothesis is the presence of 2.1–1.7 Ga orogens in most continents around the world, which might have resulted from the assembly of this supercontinent. However, most reconstructions are highly speculative, mainly due to the lack of adequate high-quality paleomagnetic data to provide independent constraints. Our latest synthesis of paleomagnetic and geological data suggests that most of the 2.1-1.7 Ga orogens may have been related to the initial stage of a longer assembly process, during which some major building blocks of Nuna were formed. Those included: (i) West Nuna (Laurentia/Greenland, Baltica, Cathaysia, Rockall and possibly India); (ii) East Nuna (North, West and South Australia, Mawson Craton of Antarctica and North China) and (iii) Siberia and Congo-São Francisco cratons. According to our model, these three blocks amalgamated into a single supercontinent (Nuna) between 1.65 and 1.58 Ga. There were also some other continents, such as Amazonia/West Africa and Kalahari, which may or may not have been parts of the Mesoproterozoic supercontinent. Nuna may have broken apart at ca 1.45–1.38 Ma by the separation between Australia/East Antarctica and Laurentia. However, West Nuna, Siberia and possibly Congo/São Francisco were rigidly connected until after 1.27 Ga. The exact timing of their breakup is still uncertain.
Using a multi-disciplinary approach, we produced the first continuous global palaeogeographic animation for the half-billion years between 1.77 and 1.27 Ga (CCFS publication #309).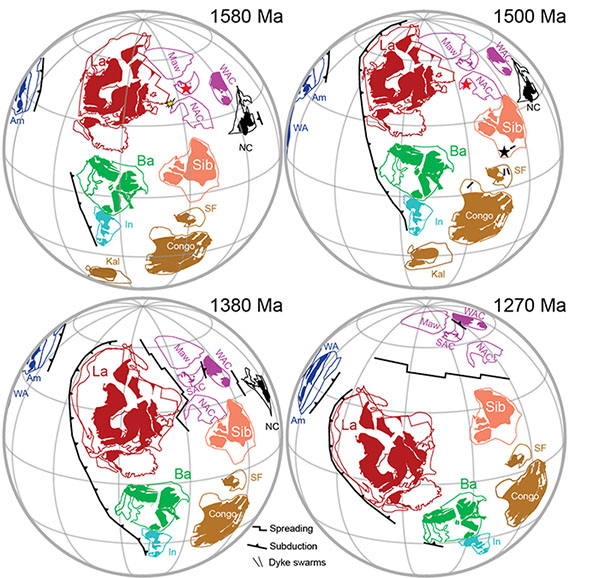
Figure 1. Mesoproterozoic global paleogeographic reconstructions. West Nuna: La = Laurentia, Ba = Baltica, In = India. East Nuna: NAC = North Australian craton, WAC = West Australian Craton, SAC = South Australian Craton, Maw = Mawson Craton, NC = North China. Si = Siberia, SF = São Francisco, Kal = Kalahari, Am = Amazonia, WA = West Africa. Filled areas represent Archean crust. Stars represent heads of mantle plumes.
Although our model may not be a unique solution, it is paleomagnetically permissible and is supported by a range of geological data. For example, reconstructions at 1.58 and 1.5 Ga (Fig. 1) demonstrate that the proposed position of the Mesoproterozoic mantle plume in South and West Australian cratons is in accord with a suggested hot spot track (Betts et al., Terra Nova 2007). The connection between Siberia and Congo/São Francisco is supported by the recently discovered matching 1.505 and 1.38 Ga dyke swarms in these continents (CCFS publication #221). The suggested time of the collision between East and West Nuna reflects the coeval orogenic events in western Laurentia and Northern Australia. Their separation may be related to the formation of the Belt-Purcell Basin in North America. The positions of parts of Australia and North China have been established in previous publications (CCFS publications #117, 197). Connection between India and Baltica is also supported geologically (CCFS publications #195, 309).
The relative positions of Laurentia, Baltica and India suggest a long-lived Mesoproterozoic active oceanic margin along their common ocean-facing edge (Fig. 1). Geological evidence for such a margin is found in all three continents (e.g. CCFS publications #195, 309).
This project is part of CCFS Theme 2, Earth Evolution, and contributes to understanding Earth’s Architecture.
Contacts: Sergei Pisarevsky, Zheng-Xiang Li
Funded by: CCFS Foundation Project 6
Fluid-induced deformation during metamorphism
The deep-Earth water cycle is strongly coupled to the dynamics of Earth’s interior. The amount of water carried into the deep mantle by descending oceanic crust is relatively small, but even a trace amount of water affects physical and chemical properties such as melting temperature, rheology, deformation mechanisms and electrical conductivity. Ophiolitic chromitites are commonly regarded as resistant to fluid-related processes, and have been used to track the evolution of Earth’s mantle convection.
Chromitites occur in the Golyamo Kamenyane serpentinite, which is a part of a dismembered metaophiolite located in the Avren synform in the upper high-grade unit of the metamorphic basement of the Eastern Rhodopes crystalline massif in SE Bulgaria. These chromitites have been subjected to high-P metamorphism, but preserve evidence of fluid-rock interaction during metamorphism. The retrograde P-T exhumation path of the Golyamo Kamenyane chromitites allowed almost complete transformation of primary chromite into several types of secondary chromites, during amphibolite-facies deformation and fluid infiltration. 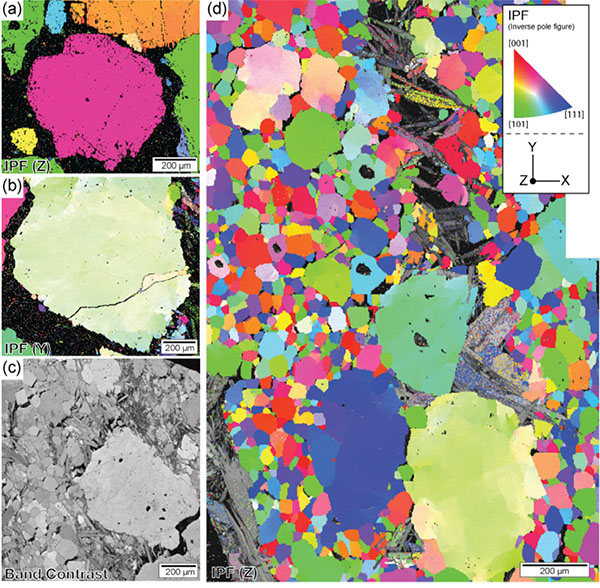
Figure 1. Crystallographic orientation maps of chromites from Golyamo Kamenyane. Rainbow scale in the maps indicated the Inverse pole figure (IPF) colour. (a) IPF map of partly altered chromite. (b) IPF map of zoned chromite. The presence of subgrain boundaries indicate crystal-plastic deformation. (c) Band contrast map of non-porous and zoned chromite. Euhedral chlorite grains fill in the chromites. (d) IPF map of non-porous chromite. Dynamic recrystallisation in coarse chromites by the development of subgrains in a matrix of recrystallised chromite.
Detailed geochemical studies based on major element components (Gervilla et al., 2012) have classified the chromitites into four textural groups: partly altered chromite, porous chromite, non-porous chromite, and zoned chromite. According to their chemical modelling, chromitites reacted with two kinds of fluids during retrograde metamorphism: (1) Si-rich fluids with very low fO2 that produced chlorite and partly altered and porous chromite, and (2) oxidising fluids that produced Fe3+-rich chromite and formed non-porous and zoned chromite grains.
To investigate the chromite deformation and identify the slip systems, crystallographic orientation measurements were obtained by using the SEM-EBSD (Electron Back-Scattered Diffraction), in the CCFS Geochemical Analysis Unit at Macquarie. EBSD reveals significant crystal-plastic deformation, such as inter-crystalline deformation defined by low-angle boundaries (Fig. 1b, d). The homogeneous distribution of subgrain boundaries in zoned chromite indicates that chromite deformed after the chemical zoning had been established (Fig. 1b). Fluid percolation also produced recrystallisation of fine grains (Fig. 1d). The fine-grained aggregates of chromite probably formed by both dynamic recrystallisation and nucleation that were enhanced by reaction with oxidising fluids. However, there is no evidence of significant deformation in the partly altered chromite (Fig. 1a). Overall, fluid-rock interaction enhances deformation of chromites, which produces recrystallisation due to both dynamic recrystallisation and nucleation.
This project is part of CCFS Theme 2, Earth Evolution, and contributes to understanding Earth Architecture and Fluid Fluxes.
Contacts: Takako Satsukawa, José-María González-Jiminéz, Bill Griffin, Sue O’Reilly, Sandra Piazolo
Funded by: CCFS Foundation Project 1 (TARDIS)
New insights into Earth’s early differentiation
To understand how Earth’s mantle has evolved over time, we need to know the chemical composition and differentiation of the primordial silicate Earth. Planetary analogs (Mars and the Moon) suggest that Earth experienced large-scale melting soon after accretion, vigorous convection in the early mantle due to higher heat production from radioactive decay, core formation, and large impacts followed by crustal recycling. All this activity is generally thought to have efficiently mixed and homogenised the mantle, obliterating all signs of Earth’s youthful exuberance. This implies that Earth started as a well-mixed homogeneous body that evolved progressively over geological time to form several chemically distinct domains. The isotopic and chemical heterogeneities observed in modern mantle-derived rocks thus are generally believed to reflect later production and recycling of oceanic and continental crust through geological time.
Figure 1. (a): EMI and DMI are the enriched and depleted types of melt inclusions from high 3He/4He BIWG picrites, compared to average normal-MORB (N-MORB), ocean island basalt (OIB), depleted MORB mantle (DMM). Lines indicate non-modal batch melting (solid lines with cross), binary mixing (green dashed lines); numbers in italics mark partial melt fractions (%). (b) Lead isotopes of Baffin Bay high-magnesium lavas. Black curves indicate evolution from the initial Pb-isotope composition of Canyon Diablo. Also shown are 4.568 Ga, 4.53 Ga, and 4.45 Ga geochrons. (c) Evolution of 3He/4He for the early formed dense chemical layer (blue) is based on the method of Class and Goldstein (2005) for an initial 3He/4He =120 RA, [3He] ranging from 2.0 × 10¹¹ to 0.8 × 10¹⁰ atomsg-1and U = 0.038 to 0.0028 ppm; Th = 0.0735 to 0.010 ppm. Evolution of deep mantle (red) and shallow mantle (grey) are from Lee et al (2010). The 3He/4He lower than 37 RA (open circles) were likely affected by post-eruption reduction of 3He/4He by 4He accumulation.
All that changed with the discovery of chemical and isotopic heterogeneities, which must have been generated ca 4.53–4.45 Ga ago, in high-magnesium lavas from Baffin Bay, which are only ca 60 Ma old (CCFS publication #354). Refractory lithophile elemental and isotopic evidence from less-evolved whole rock samples and olivine-hosted melt inclusions suggests a chemically heterogeneous source for the Baffin Bay lavas that contains enriched and depleted end-member components (Fig. 1a and b). Because the two end-members both have primitive Pb isotope compositions that plot within the geochrons of 4.53 to 4.40 Ga and coupled primitive He isotopes (Fig. 1c and d), the chemical heterogeneities likely formed in Earth’s infancy. This implies that chemical effects of early differentiation can persist in mantle reservoirs to the present day. Figure 2a illustrates how global differentiation of the early silicate Earth from 4.55 to 4.40 Ga may have produced depleted and enriched types of dense melts in an undegassed deep Earth. The global differentiation of the bulk silicate Earth would have occurred in two independent layers at >1,800 km and ≤1,800 km depths. The density contrast would produce an enriched denser liquid phase at the core-mantle boundary. In contrast, within the upper layer (≤1,800 km) the residual liquid would rise buoyantly as crystallisation proceeded until a small fraction (≤1%) of melt ultimately formed a protocrust at the Earth’s surface, resulting in depletion of 60% of the silicate Earth. The depleted dense melt may have been generated by high degree partial melting of peridotite at about 300-410 km depth, shortly after magma ocean crystallisation. These two types of dense melts would result in materials constituting the present-day thermo-chemical piles hosted within the two large low-shear-wave-velocity provinces above the core-mantle boundary, that have been protected from complete entrainment by subsequent mantle convection currents. We argue that, although such dense melts likely exhibit some ‘primordial’ geochemical signatures, they are not representative of the bulk silicate Earth. Such an early-formed dense chemical layer would continue to be sampled by mantle plumes (Fig. 2b). Our work links formation, preservation, and sampling of early chemical heterogeneities into a self-consistent geodynamic system and thus provides a strong case for mantle chemical heterogeneity being formed by a major differentiation event shortly after planet accretion rather than through the subsequent geodynamic evolution. 
Figure 2. (a) Freezing of a magma ocean produced enriched dense melts below 1,800 km depth that accumulated at the CMB, and 60% depletion of the BSE occurred at above 1,800 km depths due to positive buoyancy of the residual melt. Shortly after magma ocean crystallisation, hot and deep melting of the upper mantle could have generated depleted dense melts at 410–300 km depth. The two types of dense liquids sunk and accumulated at the CMB to form a dense chemical layer. (b) In Late Archean and later times, melting was restricted to shallow depths. The dense chemical layer is likely hosted by large low-shear-wave velocity provinces (LLSVPs) and ultralow-velocity zones (ULVZs) and appears to have persisted for much of Earth’s history.
How such a dense chemical layer can be sampled and brought to the surface is another important question. Geological evidence related to supercontinent reconstructions shows that both the location and formation of superplumes were dominantly controlled by the first-order geometry of global subduction zones. Recent studies proposed that sinking subducted slabs not only can push the dense chemical layer upward, but at the same time also push the thermal boundary layer to form thermal-chemical domes, enhancing or triggering thermal instability (Fig. 2b). Our recent studies (CCFS publication #336) show that the late-Cenozoic less contaminated and synchronous basaltic samples from the Hainan-Leizhou peninsula, the Indochina peninsula and South China Sea seamount have primitive Pb isotopic compositions that lie on, or very close to, 4.5- to 4.4-Ga-old geochrons on a 207Pb/204Pb versus 206Pb/204Pb diagram, suggesting a mantle source that developed early in the Earth’s history (4.5-4 Ga). These basalts occur above a seismically detected thermal plume adjacent to deep subducted slabs. Thus, they provide a strong case that the avalanches of subducted slabs to the CMB may have pushed up a thermal-chemical pile to form a thermal plume (Fig. 3; CCFS publication #336). The physical properties of mantle plumes also dictate that materials from the dense chemical layer near the CMB should only be a minor component of mantle plumes and thus can only be identified in the earliest phase of high temperature melts (picrites and komatiites). This implies that the ancient mantle reservoir could only be a dominant source component in the early stage of a plume magmatic event, which would then be diluted by recycled oceanic crust components as the plume magmatism continues.
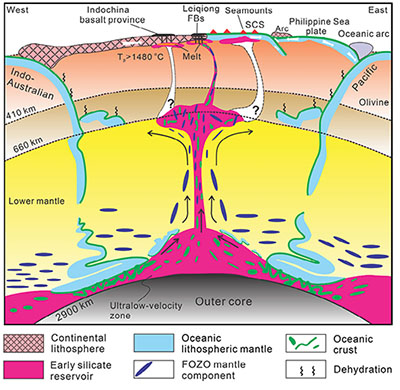
Figure 3. Formation of the Hainan plume. Broad low-velocity anomalies beneath the lithosphere and the transition zone are prominent, but the interpreted secondary plumes beneath the Indochina peninsula volcanic province and seamounts in the South China Sea (SCS) have not yet been reported by seismic tomography. Volcanism in the Indochina peninsula and the South China Sea may have been caused by thermal plumes or small-scale thermal upwellings from the edge of the broad anomaly. Early silicate reservoirs are recognised in plume-induced basaltic rocks.
This project is part of CCFS Theme 1, Early Earth, and contributes to understanding Earth’s Fluid Fluxes.
Contacts: Xuan-Ce Wang, Zheng-Xiang Li
Funded by: CCFS ARC ECSTAR funds
Zircon and baddeleyite fingerprint platinum, nickel and copper mineralisation processes at Noril’sk (Russia)
The ultramafic–mafic Noril’sk-1 intrusion in Polar Siberia (Russia; Fig. 1) hosts one of the world’s major platinum group-element (PGE)-Cu/Ni sulfide deposits. Despite years of study there is still ongoing debate about the origin of the Noril’sk-type intrusions, especially about the sources of the silicate magmas and ore metals for individual lithological units. However, it is generally accepted that the mantle-derived ultramafic–mafic magmas and PGE–Ni/Cu deposits of the Noril’sk-Talnakh region in Russia are closely linked, implying that juvenile mantle-derived materials are intrinsic to their petrogenesis. It is also commonly assumed that the ‘Noril’sk-type’ intrusions are genetically linked to the 250 Ma Siberian flood-basalt volcanism.
Figure 1. (A) Schematic map of Siberia, Russia and (B) location of Noril’sk-1 intrusion relative to the Siberian flood-basalt formation (CCFS Publication #215).
Nd-Sr-Os-Pb isotopic studies of the main units of the economic Noril’sk-type intrusions and their ores have contributed to a better understanding of the origin of Noril’sk-type intrusive hosts and associated ores. The Os- and Pb-isotope compositions of the PGE–Cu/Ni sulfide ores preserve mantle-like values, and it has been suggested recently that staged chambers played an important role in the evolution of the Noril’sk-type deposits. Whole-rock Nd-isotope data represent the homogenised end product of these processes; they provide cumulative information and do not tell much about magma sources during the evolution of the ultramafic-mafic magmas. The wide variation of Hf-isotope values in zircon in rocks with homogeneous whole-rock Nd-isotope data has been documented previously (see GEMOC Publications #251, #491), demonstrating that the zircon data provide superior constraints for end-member mixing components. This emphasises the usefulness of in situ analytical techniques, where the Hf-isotope composition of the zircon records the evolution of the magma chamber, with input of magmas from different sources, and/or progressive contamination by country rocks. 
Figure 2. Examples of zircon in situ in thin sections (A, B; in back-scattered electrons) and mineral separates (C, D; in transmitted light) from rocks of the Noril’sk-1 intrusion (GEMOC Publication #720). A, B, Assemblages of zircon and rock-forming minerals from olivine gabbro and taxitic pyroxene leucogabbro. Zr, zircon; Cpx, clinopyroxene; Pl, plagioclase. C, D, Inner structure of polyphase grains, composed of “cores” (Zr1 and Zr2) and “rims” (Zr3 and Zr4).
However, there are few such data on zircon from the Noril’sk-type intrusions. To fill this gap we have explored the isotope systematics of Hf in zircon (Fig. 2) and baddeleyite from variously mineralised rocks of the economic Noril’sk-1 intrusion (CCFS Publication #215). In-situ Hf-isotope data of zircon and baddeleyite, combined with whole-rock Nd-isotope results, identify three distinct clusters of Hf-Nd isotope values (Fig. 3) typical of different lithological units (e.g. unmineralised gabbroic rocks, mineralised ultramafic and taxitic-textured rocks with disseminated PGE-Cu-Ni sulfide ores, and gabbro-diorite). These groupings suggest the interaction of three distinct magma sources during the protracted evolution of the Noril’sk-1 intrusion: (1) a juvenile source equivalent to the Depleted Mantle, (2) a subcontinental lithospheric mantle source and (3) a minor crustal component. It appears that the Hf-isotope composition of zircon and the Nd-isotope compositions of unmineralised lithologies were decoupled. These data also suggest that a prolonged period for concentration of the ore components in staged chambers during this interaction is a key factor for the formation of economic deposits, and that the zircons can fingerprint this process as a guide to exploration.
Figure 3. Plot of zircon εHf(T) versus whole-rock εNd(T), identifying three distinct clusters for the Noril’sk-1 intrusion. Mantle and crustal arrays according to Vervoort et al. (Geochim. Cosmochim Acta, 63, 1999).
The zircon and baddeleyite from Noril’sk-1 show isotopic and geochemical features that are not usually expected for mafic and ultramafic rocks. Models for the origin of the Siberian flood basalts and their relationships to the Norilsk-type intrusions should be further investigated in light of new Hf-Nd isotopic constraints, which indicate a complex geological history for the economic ultramafic-mafic intrusions of the Noril’sk region.
This project is part of CCFS Themes 2 and 3, Earth Evolution and Earth Today, and contributes to understanding Earth Architecture and Fluid Fluxes.
Contacts: Elena Belousova, Bill Griffin, Sue O’Reilly, Norman Pearson
Funded by: ARC Future Fellowship, Macquarie University contribution to ARC FT, CCFS Foundation Project 1 (TARDIS)
Giant porphyry copper deposits on the roof of the world flow from deep wet crust
The Gangdese porphyry copper belt in Tibet, the roof of the world, is the richest porphyry copper system known to have developed in a continental collision zone. Five porphyry copper – molybdenum (Cu-Mo) deposits are currently being mined in this province, accounting for an estimated 18 million tons (Mt) of contained copper-10.5 Mt of this in the giant Jiama deposit alone (Fig. 1). Seven additional prospects are under active exploration in the region, and it is clear that the potential of the belt has not been fully unlocked. 
Figure 1. The giant Jiama porphyry Cu deposit in Tibet. Photo taken from the elevation of 5000 m.
These porphyry Cu deposits developed in the Miocene, significantly post-dating the collision of India with Asia, so the most common model of porphyry copper genesis in association with oceanic subduction cannot be applied here. One of the most striking features of the metalliferous deposits is their close association with adakite-like intrusions, felsic igneous rocks with high Sr and Eu contents, and high Sr/Y ratios. These intrusions are widely attributed to dehydration melting (in the absence of free water) of garnet-amphibolite and/or eclogite facies rocks in the thickened crust below Tibet. However, the associated mineralised porphyries contain more than 9% water by weight, and cannot be derived through any simple evolution of melts originating from anhydrous high-grade metamorphic parent rocks. This presents a dilemma in explaining the development of this important endowed province.
To resolve this dilemma, we are looking at the wider regional context of these porphyries to produce an internally consistent model that can account for their key characteristics, and give a key to developing strategies for further exploration of the Gangdese belt.
In addition to the water problem, dehydration melting of amphibolites and/or eclogites does not produce melts with the chemical characteristics that match the inferred ore-forming magmas. Such melting would consume the hornblende in the source rocks before plagioclase began to melt, and would not produce the adakite-like melts with high Sr and Eu contents and high Sr/Y. However, a high H2O content in the starting material (and the resultant partial melt) stabilises hornblende to higher temperature and lowers the melting point of plagioclase. If significant amounts of water were added to the mafic lower crust, the chemical problems thus would be solved -- but how can large volumes of water be fluxed up into the lower crust in the Miocene, long after the cessation of oceanic subduction beneath this region?
We suggest that the coeval ultrapotassic lava flows of South Tibet provide the missing link in this puzzle. These mafic rocks are notably water-rich. Furthermore, the solubility of water in such ultrapotassic melts increases with increasing pressure, and therefore as the melts ascend, they release free water into the surrounding wall-rocks. Although they are rare at the surface, significantly larger volumes of ultrapotassic rocks are believed to occur at depth beneath the Tibetan lower crust, and underplating and crystallisation of these mantle-derived rocks may have provided the fluid required to catalyse the development of the fertile Tibetan porphyries in the Miocene.
This conceptual model is illustrated in Figure 2. We suggest that metasomatism of the lithospheric mantle and Jurassic underplating of arc melts below Tibet were essential to pre-condition the region for the subsequent development of the mineralised porphyries. In the Miocene, lithospheric thinning – probably due to convective removal of lithosphere during Himalayan orogenesis – caused melting of the water-rich metasomatised mantle domain, producing hydrous ultrapotassic-potassic melts. In the extensional conditions that prevailed across the western portion of the southern Lhasa subterrane, these mantle-derived magmas were able to ascend into the upper crust – and locally erupt. In the more compressive contemporary regime to the east of this subterrane however, the ultrapotassic-potassic magmas ponded in the lower crust. Release of water from the crystallising magmas then triggered melting of the overlying Jurassic arc material to produce the hydrous and adakite-like intrusions and associated porphyry Cu deposits.
This project is part of CCFS Themes 2 and 3, Earth Evolution and Earth Today, and contributes to understanding Earth’s Architecture and Fluid Fluxes.
Contacts: Yong-Jun Lu, Marco L. Fiorentini, Cam McCuaig
Funded by: CCFS foundation project 2a, 9, ARC CCFS ECSTAR funds
Figure 2. A conceptual model for the genesis of the hydrous fertile Tibetan porphyries, as outlined in the text.
Modelling multi-phase reactive flow in the mantle: a bottom-up approach
The physico-chemical processes that govern the evolution of continental lithosphere and its interaction with the sublithospheric upper mantle occur over very different spatial and temporal scales. The details of the interactions between these different scales and the resulting integrated macroscopic effects on the evolution of plates are still poorly understood. In order to understand these multi-scale (geological) processes, we need to be able to accurately simulate/model all the processes involved in natural multi-phase multi-component reactive systems. Unfortunately, although several groups are making progress towards this end, most modelling platforms available to the geodynamic community do not really deal with all these problems in an internally-consistent manner. It also can be difficult to scale them to a wide range of problems (e.g. from melting in cm-scale veins to mantle convection).
To bypass these limitations we take advantage of a novel numerical framework known as the Multi-scale Finite Element Method (MsFEM). The main idea is to capture the small-scale details of a problem and transfer them to the macro-scale through consistent and robust coupling of the micro- and macro-problems (back and forth). In particular, the MsFEM replaces the basis functions used in the traditional FEM, with a new set of micro-problem-dependent functions. This development provides a new numerical platform directly applicable to modelling geological phenomena such as the generation, migration and emplacement of magmas, chemical entrainment, transport of geochemical species, deposition mechanisms of sulfide liquids, the formation of ore bodies in hydrothermal systems, etc. Importantly, these “small-scale” processes are consistently coupled, in our numerical framework, to the large-scale driving tectonic processes, and that coupling allows us study the complex interactions between these different scales. So far, the MsFEM has been successfully applied and tested in fields such as composite materials, petroleum reservoirs and groundwater transport, but not yet in the large-scale analysis of the lithosphere-asthenosphere system. 
Multi-phase reactive flow is governed by a multitude of balance and constitutive equations that need to be solved accurately with numerical methods. Ones of particular importance are the so-called “advection-diffusion-reaction” and the “momentum” equations, governing heat transfer and momentum transfer, respectively. Stability and accuracy analyses for these equations are well known and have been the subject of thousands of papers in the numerical community. Although there are many ways to solve these equations, not all of them are appropriate to a multi-scale approach. Moreover, the robustness, accuracy, and efficiency of many of these algorithms are still debatable when they are applied to geodynamic processes at different scales. This is due partly to poorly documented tests and benchmarks and partly to the geodynamics community’s lack of any broad interest in multi-phase multi-component reactive flow.
As part of a larger CCFS Foundation Project 4, we are currently developing/testing a number of individual algorithms particularly designed to work under a multi-scale formalism for geodynamic problems.
In particular, we have developed a new Lagrangian-Eulerian algorithm for advection-diffusion-reaction, which is proving to have remarkable accuracy, scalability, and generality. This finite-element algorithm combines the best features of fixed-mesh and marker-in-cell methods into a single conservative scheme that can accurately model processes in which there are large advective and reactive components together with isothermal and non-isothermal phase changes. We have also tested and improved existing multiscale algorithms that may be applicable to specific sub-problems. In parallel, we have implemented an efficient and fully compressible Lagrangian-Eulerian iterative solver (based on the “Uzawa scheme”) for the momentum (and mass) equation and fast thermodynamic solvers for the computation of phase equilibria/component distributions. The internally-consistent combination of these three main components into a single thermo-chemical-mechanical algorithm will allow us to simulate a large variety of fluid-assisted geodynamic processes.
This project is part of CCFS Themes 2 and 3, Earth Evolution and Earth Today, and contributes to understanding Earth’s Architecture and Fluid Fluxes.
Contacts: Beñat Oliveira, Juan Carlos Afonso
Funded by: CCFS Foundation Project 4
Straining to transform from continent to ocean
The Grisons, in the Eastern Alps (Switzerland) have preserved an ocean-continent transition; numerous studies during the last decade provide an excellent structural framework. This area represents a section across a zone of exhumed continental mantle. Sub-continental spinel peridotite is exposed close to the continent (Totalp area) while the mantle further from the continent was infiltrated by melt and equilibrated in the plagioclase stability field (Platta area) (Fig. 1). The sequence includes highly deformed peridotites (ultramylonites) that allow us to study the evolution of deformation within an ocean-continent transition. A detailed study of the peridotite textures and geochemistry was combined with the analysis of the crystallographic orientation of minerals using the electron backscatter diffraction method (EBSD).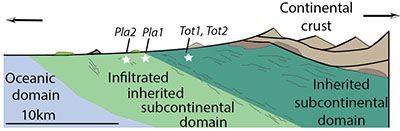
Figure 1. Schematic representation of an ocean-continent transition (after Peron-Pinvidic & Manatschal, 2009, Int.J.Earth.Sci, Muntener et al. 2010, J.Pet).
We sampled the Platta-Totalp massifs made of spinel lherzolites and harzburgites, intruded by gabbros and basaltic dykes, and partially covered by ophicarbonates. In Totalp, blocks of ultramylonites within a cataclastically deformed domain related to mantle exhumation, and ultramylonites parallel to the foliation of amphibole-bearing peridotites, were sampled. The ultramylonite blocks are formed by unmixed layers of olivine (ol) + orthopyroxene (opx) and clinopyroxene (cpx) + amphibole (Fig. 2a). Opx and ol grains are elongated, whereas the amphibole is interstitial and replaces the clinopyroxene. The ultramylonites have a fine-grained matrix (grain size 2-10 µm) composed of ol, opx, cpx, spinel and amphibole with rounded amphibole porphyroclasts (Fig. 2b). Pargasitic amphibole occurs in the former whereas kaersutitic amphibole characterises the latter. The kaersutite was related to pre-deformation metasomatism with K2O enrichment from porphyroclasts to neoblasts during localisation of deformation (Fig. 3). The pargasite formed later than the kaersutite and was probably related to the exhumation of the mantle. The crystallographic preferred orientations of the kaersutite within the host peridotite are inherited from the porphyroclastic amphibole with a reorientation of <001> axes, to become parallel to the foliation. In the ultramylonitic matrix, the amphibole grains have elongated shapes and their <001> axes are parallel to the foliation, suggesting either a strong grain rotation or a dynamic recrystallisation.
Figure 2. (a) Ultramylonite made by unmixed layers. Layers are clinopyroxene replaced by interstitial amphibole or olivine and orthopyroxene; (b) Ultramylonite contains round porphyroclasts of amphibole within a matrix of olivine, opx, cpx, amphibole and spinel.
The clinopyroxene composition has been analysed for Totalp and Platta samples. There is no distinct difference among the Totalp samples, but samples from Platta have lower Na2O, suggesting melt percolation and crystallisation of plagioclase. Some Platta samples show slightly lower Na2O suggesting less melt infiltration, and has a more continental affinity (Figs. 1 and 3). In porphyroclastic clinopyroxene from the host peridotite in Totalp, the activated slip is (010)[100], which is uncommon and marginal in peridotites because of using a large burger vector (Fig. 4a). In clinopyroxene porphyroclasts <100> axes are parallel to the foliation whereas the recrystallised grains show a reorientation with <001> axes more parallel to the foliation (Fig. 4b, c). Olivine porphyroclasts within the host peridotite show the activation of two slip systems within a single grain: (001)[100] and (100)[001]. In the fine-grained ultramylonitic matrix the dominant activated slip system is (001)[100] E-type.
Figure 3. Chemical composition of amphibole (TiO2 vs. K2O wt%) and clinopyroxene (Cr2O3 vs. Na2O wt%) from Totalp and Platta.
The results obtained in 2013 show that the transition from subcontinental to infiltrated subcontinental mantle towards the ocean involved a compositional evolution and a change in deformation mechanisms. The presence of amphiboles testifies to fluid percolation before deformation, and tracks chemical evolution of the fluid during localisation of deformation. The amphibole and clinopyroxene crystal preferred orientations in the host peridotite are partially inherited from the primary texture, and overprinted by several mechanisms such as grain rotation, dynamic crystallisation and/or grain boundary sliding when the strain increases.
This project is part of CCFS Themes 2 and 3, Earth Evolution and Earth Today, and contributes to understanding Earth’s Architecture and Fluid Fluxes.
Contacts: Mary-Alix Kaczmarek, Steve Reddy
Funded by: CCFS, Curtin University (Perth), The Swiss National Foundation (SNF), The University of Lausanne
Figure 4. Clinopyroxene individual grains orientation maps and lower hemisphere equal area stereographic projections of crystallographic data. (a-b) EBSD orientation map colored for cumulative misorientation (in degrees) relative to reference orientation indicated by a red cross, pole figures of major crystallographic planes for every data point indexed on map, and plot misorientation axes for (2–10°) interval between neighbouring data points. (c) crystal preferred orientations of recrystallised grains of clinopyroxene showing an inherited texture from the porphyroclasts. The number of analysed grains is n=339.
Mantle dynamics model constrained by plate history
The temporal evolution of the Earth’s internal structure is very important to geoscience research, however this time-integrated evolution cannot be observed directly by available techniques. Mantle convection simulations are thus important tools to investigate this problem.
Subducting slabs descending deep into the mantle will carry, and subsequently release, water: this can promote partial melting in mantle rocks, resulting in volcanoes overlying deep, dewatering subducting slabs. Such volcanic activity can concentrate incompatible elements from Earth’s interior at the surface, so models that can predict subduction dewatering pathways are of significant value to the mineral-exploration industry. However, plate boundaries have moved a lot in the past, obscuring the history of magmatism. We are developing dynamic models that can reconstruct the P-T-t path of minerals in subduction zones, and also the water content of subducting lithologies. Adopting mineral physics studies on the mantle solidus and partial melting, we will be able to calculate melting percentages and eruption rates to track the history of subduction zone volcanic activity through time, and provide quantitative and temporal maps of the generation and migration over the past few million years on a global scale.
In our approach, we use the open-source code ASPECT; this is a highly-parallelised and modularised code that uses the adaptive mesh refinement technique to achieve much better resolution than conventional approaches, at reasonable computational costs. It also supports temperature, pressure and composition - dependent simulation parameters, allowing us to adopt more realistic mineral physics models. Plate tectonics is the dominant control on the mantle flow pattern, and plate reconstructions from geophysical and geological data provide crucial constraints on surface motions in the past few hundred million years. In our mantle convection models, we use plate history as a time-dependent surface boundary condition.
Using this approach, our model successfully recovers the position of major subducting slabs and mantle upwellings, in accordance with present day seismological observations. Building such a model requires large amounts of computational power, and current models are running on a cluster with a few hundred CPUs, which may not be have the capacity to achieve the required resolution. A new resource allocation from Intersect, has delivered more computing power that will allow refinements of the current resolution over the next year.
This project is part of CCFS Theme 2 and 3, Earth Evolution and Earth Today, and contributes to understanding Earth’s Architecture and Fluid Fluxes.
Contacts: Siqi Zhang, Craig O’Neill
Funded by: CCFS Foundation Project 4
Figure 1. Snapshot at 85.9 Ma ago shows subducting slabs and plumes reconstructed by the mantle convection simulation constrained by plate history. In the left-hand figure, the transparent surfaces show contours of temperature; the present day coast-lines are shown in white. In the right-hand figure, the arrows show the surface motion constrained by plate reconstruction, and present-day coastlines are shown in black.
Zircon signposts for Gold
Multi-isotopic maps are a powerful tool for imaging lithospheric blocks of different age, and have been used in the Yilgarn Craton of Western Australia. Such maps combine in situ zircon U-Pb and Lu-Hf isotopic analyses with whole-rock Sm-Nd data. As the ancient lithospheric boundaries sometimes cannot be seen in modern seismic images, the isotopic mapping serves as a form of ‘paleogeophysics’ for imaging paleocraton margins through time. 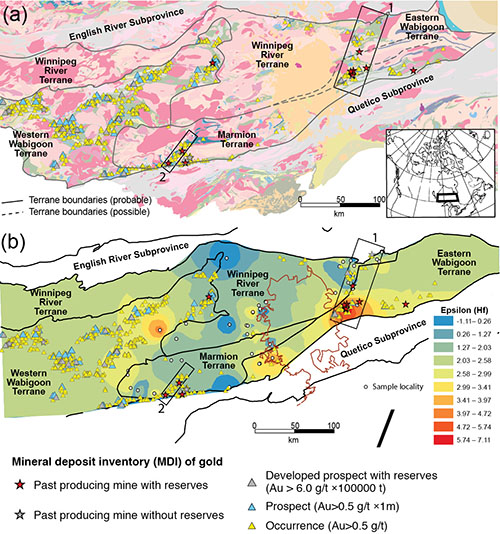
Figure 1. Spatial distribution of gold mineralisation and terrane boundaries within the Wabigoon Subprovince, Canada. (a) Geological map of the Wabigoon Subprovince showing terrane boundaries based on whole-rock Nd isotope data (Tomlinson et al., Precambrian Research 2004). Different colors represent different geological units. The inset shows the location of the study area. (b) Zircon Hf-isotope mapping of the Wabigoon Subprovince with the revised terrane boundaries after Stott, OGS, 2011. The contour bar shows the Epsilon Hf value of zircons studied. The rectangles labeled 1 and 2 highlight the two gold camps in Eastern Wabigoon and the Marmion terrane, respectively. The most economic gold mineralisation discovered to date is represented by red and grey stars.
There is a strong spatial correlation between lithospheric boundaries and the concentration of a variety of mineral deposit types; these isotopic boundaries mark lithosphere-scale structures that control magma and fluid flux, and thus the location of large mineral systems through time. However, the only available case study in the Archean is the Yilgarn of WA, and even that is only focused on the centre of the craton. Therefore, we have tested this hypothesis in the Wabigoon Subprovince in the western part of the Superior Craton of Canada.
The Wabigoon Subprovince previously has been subdivided into four terranes based on whole-rock Sm-Nd isotopic data (Fig. 1a; Tomlinson et al. Prec. Res., 2004). Gold mineralisation is pervasive within the Wabigoon Subprovince, with numerous gold occurrences and prospects (Fig. 1a). The most economic gold mineralisation, i.e. gold mines represented by red stars, clusters mainly in the Eastern Wabigoon and Marmion gold camps (rectangles 1 and 2, respectively in Fig. 1a). However, no relationship between these important gold camps and the terrane boundaries is obvious in Figure 1a. For example, the terrane boundary in Eastern Wabigoon was assumed to trend E-W, whereas the gold mineralisation trends N-S. The Marmion gold camp trends NE, but is far away from the terrane boundary (Fig. 1a).
Figure 1b shows new mapping of Hf-isotope compositions in zircon, undertaken in this study. The warm colours represent relatively juvenile blocks with higher Epsilon (Hf) values, whereas the cold colours represent relatively ancient blocks with lower Epsilon (Hf) values. The boundaries of these isotopic domains are interpreted as lithospheric boundaries between different terranes. The revised terrane boundary in Figure 1b is mainly from Stott, OGS, 2011. It can be seen that the new zircon isotopic mapping results fit well with the revised terrane boundaries (Fig. 1b). In particular, the boundary between the Winnipeg River and Eastern Wabigoon Terranes now trends NE, consistent with the gold trend (rectangle 1 in Fig. 1b).
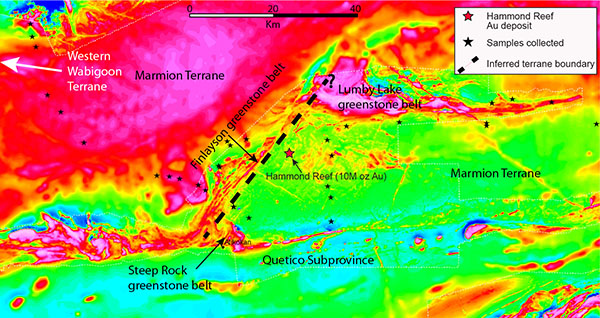
Figure 2. Residual total-field magnetic image of the Marmion Terrane. Warm and cold colors represent positive and negative magnetic anomalies, respectively. The magnetic character shows a marked change in the Marmion terrane across the NE-trending Finlayson greenstone belt, which can be inferred as a terrane boundary. The Hammond Reef deposit with 10 Moz Au is proximal to the inferred terrane boundary. However, this magnetic image probably only shows features down to about 20 km depth, and therefore does not image the deep lithosphere, unlike the isotopic data. The boundary between the Marmion and Western Wabigoon terranes is west of this map area, as indicated by the white arrow.
This coincidence supports the hypothesis that the terrane boundaries exert important controls on the location of significant gold mineralisation. A significant observation is that there are no gold mines within the ancient Winnipeg River Terrane, but instead the gold mines cluster within the Eastern Wabigoon Terrane, which is a juvenile block. This spatial relationship of gold with more juvenile rocks is similar to that observed in the Yilgarn Craton of Western Australia.
The Marmion gold camp is intriguing as it occurs along a NE-trending zone within the Marmion Terrane (Fig. 1b). There are currently not enough zircon Hf data on both sides of this gold camp to reveal the isotopic signature of the lithosphere (Fig. 1b). However, Figure 2 shows a contrast in magnetic anomalies on both sides of this NE-trending structure within the Marmion terrane. The Hammond Reef deposit with 10 M oz of Au is close to this structure, highlighting the potential importance of this inferred terrane boundary (Fig. 2).
In summary, it appears that the spatial distribution of gold in the Wabigoon Subprovince is controlled by the terrane character (juvenile) and potentially their boundaries with ancient blocks (paleocraton margins), similar to the scenario in the Yilgarn Craton. Zircon isotopic mapping is a powerful tool to image the lithospheric boundaries and thus, can become a robust pathfinder to gold deposits.
This project is part of CCFS Themes 2 and 3, Earth Evolution and Earth Today, and contributes to understanding Earth’s Architecture.
Contacts: Cam McCuaig, Yong-Jun Lu, Katarina Bjorkman
Funded by: ARC ECSTAR Fellowship, CCFS Foundation Project 9
Diamond growth at the nanoscale – Mantle fluids at work
Diamondites are polycrystalline aggregates of diamond crystals with heterogeneous grain sizes and random orientation that formed in the Earth’s mantle. They have a highly porous structure, which indicates that they precipitated from a volatile-rich medium strongly oversaturated in carbon. Gem-sized diamonds can contain a long history of growth and dissolution resulting in complex zonation patterns (CCFS publication #168).
In contrast, diamondites may form rapidly, presenting snapshots of diamond formation conditions that complement the information from slowly grown gem-sized diamond.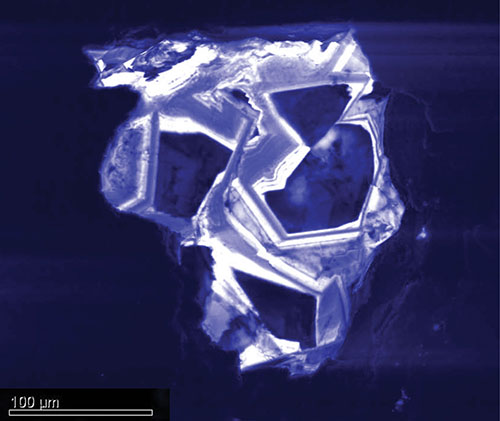
Figure 1. Cathodoluminescence image of diamondite showing complex zoning that most likely corresponds to episodic growth from a fluid dynamically changing in composition.
New microanalytical methods have allowed diamond studies to be carried to the next level, as submicron inclusions are now accessible, thus building on a solid foundation from studies of large inclusions, which are usually in the range of 200-300 µm. In situ analysis of diamonds and their inclusions is now able to span roughly six orders of magnitude in spatial resolution and draw critical complementary information from either end of this range. Large inclusions in diamondites are mostly intergrown with the diamond crystals rather than included. They record the general chemical environment of diamond formation, but can be subject to metasomatism that postdates diamond formation (CCFS publication #210). In contrast, submicron-sized minerals included in the diamond crystals are shielded and contain the fluid from which the diamond precipitated.
To reveal more about the relationship between the diamond fluid and the growth mechanisms of the diamond crystals, we employed Transmission Electron Microscopy, enhanced with Focused-Ion Beam sample preparation, Transmission Kikuchi Diffraction Analysis and Nano-SIMS, enabling detailed analysis at the submicron scale and direct sampling of the diamonds’ parental fluids included in the stones (Jacob et al., Earth Science Reviews, in review)
In situ sampling of diamond fluids reveals a large heterogeneity in redox conditions and chemical compositions at small scale, which is not reflected in the macro-inclusion suite. However, these fluids have compositions that correspond to the fluid end-members established by studies on fibrous diamonds; this suggests a universally important role for a limited number of basic ingredients, namely carbon, silicon, halogens and water.
Preliminary studies (Rubanova PhD Thesis, see CCFS Postgraduates) indicate that the crystals in diamondites may have grown not only by the octahedral (spiral/dislocation) mechanism, but also by cuboid (rough, adhesive type) growth. This suggests that other governing parameters, just beyond extreme carbon supersaturation, play an intrinsic role in their growth. Both growth mechanisms also occur in gem-sized diamonds, and the study of diamondites may tie these together in an integrated model and help define the impurities, oxygen fugacity, and episodic nature of these deep mantle fluids. Thus, diamondites could act as “Rosetta Stones” that can provide critical information about diamond growth and fluids in the Earth’s mantle.
This project is part of CCFS Themes 2 and 3, Earth Evolution and Earth Today, and contributes to understanding Earth’s Fluid Fluxes.
Contacts: Dorrit Jacob, Dan Howell, Bill Griffin, Sue O’Reilly, Sandra Piazolo
Funded by: CCFS
The leading edge in pits: the hole story for laser ablation ICP-MS
Conceptually, laser ablation is a simple process; material is removed from a solid (or liquid) sample by irradiation with a laser beam. In this sense laser ablation (LA) can be thought of as the micro-scale equivalent of taking a sledgehammer to an outcrop. However, the real power of laser ablation is that the sampled material can be directly transported into a plasma-source mass spectrometer, allowing rapid measurement of elemental abundances or isotope ratios. Researchers at Macquarie were among the pioneers in developing new analytical methods using laser ablation ICP-MS, and established early on, that the quantification of elemental abundances or isotope ratios is rather more complicated than a fantasy-world version of ‘star-wars’ mass spectrometry. As part of the development of leading edge analytical methods involving new laser hardware, CCFS researchers are revisiting the basics of how a laser beam interacts with minerals.
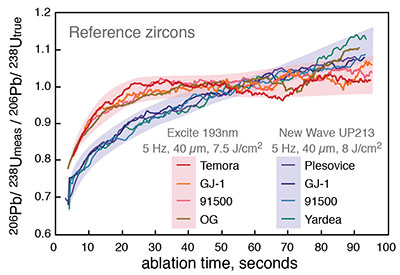
Figure 1. The plot of normalised 206Pb/238U (measured ratio relative to true ratio to remove the effect of age) vs time for selected reference zircons provides a comparison of 193 nm and 213 nm laser systems.
The ablation behaviour of different minerals for specific wavelengths of light is well-documented in the literature.
The degree of coupling between the laser beam and different minerals is indicated by the amount of material removed from the hole; in quantitative elemental analysis this is corrected by use of an independently determined internal standard (an element of known concentration). A more significant issue is the progressive change in the ratios of measured signals of certain element pairs or isotope pairs as the laser drills into the sample. This is referred to as ‘down-hole fractionation’. Elemental fractionation occurs because preferential ablation of some elements (low-volatility elements) in the sample results in non-stoichiometric sampling and analysis. Perhaps the best-documented example of laser-induced elemental fractionation is the changes in measured Pb/U and Pb/Th ratios in zircon as drilling proceeds.
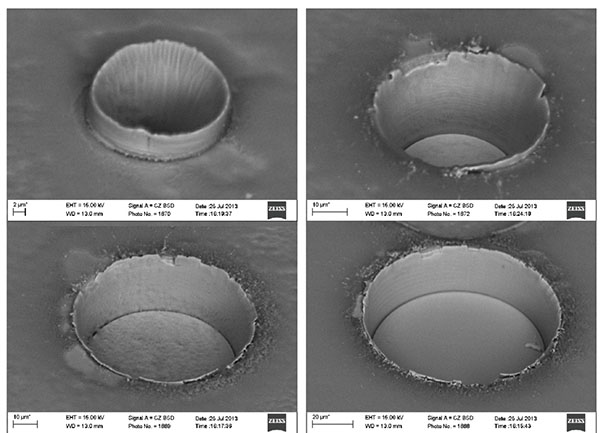
Figure 2. Back-scatter electron images of different laser spot sizes in GJ zircon. Note the marked development of the ‘crown’ of melt material on each pit, but especially the 15 µm diameter pit.
Down-hole laser-induced fractionation is one of the largest contributions to the uncertainty budget of LA-ICP-MS measurements of trace elements and isotope ratios. Efforts to improve the accuracy of analyses and to reduce the uncertainties associated with laser-induced fractionation have involved developments in both laser hardware and data-reduction software. Advances in cell design have improved the quantitative transport of material from the ablation site to the ICP, giving increased sensitivity and reduced fractionation. Rastering the laser, or using short acquisition times, are also commonly used to minimise downhole fractionation, but these compromise spatial resolution and depth information. Linear and exponential down-hole models are used in many data-reduction software packages and reflect the basic fractionation response for a wide range of laser specifications and operating conditions. In most models the fundamental assumption is that matrix-matched standards and samples ablate similarly with consistent time-depth relationships. However, further software advances are limited by our current understanding of the fundamental processes of ablation.
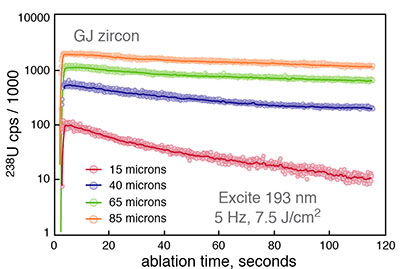
Figure 3. Plot of 238U signal intensity (counts per second) versus time for 4 different spot sizes (15, 40, 65, 85 µm) in GJ zircon.
An investigation of the ablation characteristics of common minerals is part of the CCFS Foundation Project ‘Frontiers in integrated laser-sampled trace-element and isotopic geoanalysis’. The aims are to assess the effect of laser wavelength, pulse width, spot size and fluence, in conjunction with laser-cell design and gas composition and flow rate. In the first phase of the study the focus has been on the ablation of zircon to establish the optimum set of hardware parameters and operating conditions to maximise spatial resolution, and to minimise ablation rate and U-Pb fractionation.
A distinctive down-hole fractionation of U and Pb is observed in ablation of zircon using 213 nm and 193 nm wavelength lasers (Fig. 1). The change in ratio from both systems is greatest in the first 150-200 laser pulses (20 to 30 seconds of ablation) but for the chosen operating parameters the 193 nm data show little further change with time, whereas the ratios produced by the 213 nm laser continue to increase with time.
Figure 4. Plot of measured 206Pb/238U versus time for 4 different spot sizes (15, 40, 65, 85 µm) in GJ zircon.
Laser fluence and spot size have significant effects on ablation rate and fractionation. Ablation rate increases with fluence but more slowly for larger spot sizes. A series of images taken after a set number of laser pulses shows the development of a crater wall that forms from the initial laser pulse and grows in height with time by the addition of melt material extruded from the pit (Fig. 2). The development of this wall is more pronounced with small spot size and low fluence. There is also a significant decay in signal intensity with time, especially with small spot sizes, indicating that progressively less material is being removed from the hole and transported to the ICP (Fig. 3). The net effect is a greater fractionation of 206Pb/238U with small spot size due to the retention of melt and condensed material in and around the laser pit (Fig. 4).
One of the main drivers for investigating the fundamentals of the ablation process is to get higher spatial resolution but without compromising data quality. The results of the first stage of the study have produced a better understanding of how zircon ablates and the fractionation of U and Pb using a nano-second pulse laser system. This will form the benchmark for the next exciting experimental phase using the femto-second laser system.
This project is a Technology Development initiative in CCFS, contributes across all Themes (Early Earth, Earth Evolution and Earth Today), and contributes to understanding Earth’s Architecture and Fluid Fluxes.
Contacts: Norman Pearson, Bill Griffin, Sue O’Reilly, Will Powell
Funded by: CCFS Foundation Project ‘Frontiers in integrated laser-sampled trace-element and isotopic geoanalysis’
Are ancient zircon ages real, or due to ancient element movement?
Zircons from the Tula Mountains, Napier Complex (East Antarctica), attracted scientific attention because they come from some of the oldest rocks on Earth (Black et al., CMP, 1986), which experienced high-temperature metamorphism at
2.8 Ga and ultra-high-temperature metamorphism at 2.5 Ga, with temperatures estimated at over 1100 ºC (Hokada et al., Prec. Res., 2005), some of the highest temperatures recorded in Earth’s crust. Isotopic disturbance of zircons >ca 3.4 Ga old from the Napier Complex has been recognised for many years (Williams et al., CMP, 1984). To investigate this phenomenon further, we analysed zircon grains from three samples: one orthogneiss (from Gage Ridge) and two paragneisses (one each from Mount Sones and Dallwitz Nunatak). The analysis included U-Pb geochronology, oxygen isotopes, REEs, Raman spectroscopy and scanning ion imaging. All samples yielded reversely discordant data; the zircons from Mount Sones are significantly younger than those from the other two samples with an age range from 3.0 Ga to 2.5 Ga. Detrital zircons from Dallwitz Nunatak yield ages between 3.5 Ga and 2.5 Ga. The Gage Ridge sample contains four age groups with concordant data between 3.6 Ga and 3.3 Ga (Kusiak et al., 2013a) and a discrete population of ca 3.8 Ga zircon with reversely discordant data. The REE distribution in zircon from all three samples is generally similar, with steep MREE to LREE trends, consistent with an igneous origin. However, such patterns are also present in metamorphic zircon that grew in the absence of garnet. The sample from Mount Sones contains garnet that grew during ultra-high temperature (UHT) metamorphism (ca 2.5 Ga), and, like Kelly and Harley (CMP, 2005), we suggest that 2.8 Ga zircon grew during metamorphism under high-temperature and low-pressure conditions in the absence of garnet.
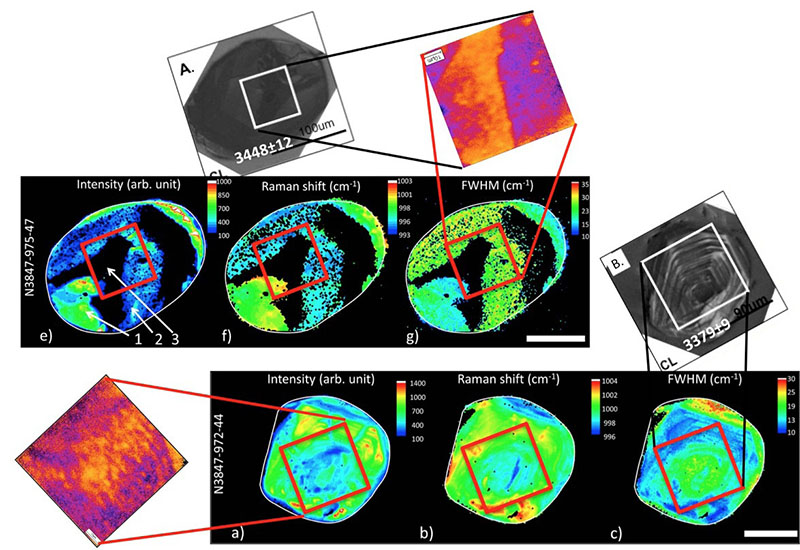
Figure 1. Raman spectroscopy maps of the two analysed grains: A. Gage Ridge, B. Dallwitz Nunatak. Numbers corresponding to grain A: 1. A medium radiation damaged zone; 2. Amorphous area; 3. Glassy area (after Kusiak et al., 2013 a, b; modified).
To test for U/Pb disturbance during metamorphism we analysed oxygen isotopes in zircon from all three samples. Igneous zircons from Gage Ridge have lower δ18O values (4.7-6.8‰) than zircons from the paragneisses. However, the Dallwitz Nunatak zircons give a scattering of ages, and δ18O varies from 6.8-8.0‰ (average δ18O – 7.4‰), as might be expected for detrital zircons. Low scatter in δ18O in zircons from the Mount Sones paragneiss, together with high values (7.2-8.9‰, average δ18O – 8.1‰), are consistent with growth during the earlier metamorphism at 2.8 Ga.
A novel high-resolution ion-imaging technique using the Cameca 1280 SIMS was used to generate maps of Pb-isotopic “age” for selected zircons. These record patchy variations in the isotopic ratios that result in spurious ages, including some that are Hadean (>4.0 Ga). Raman spectroscopy was used to determine the degree of metamictisation in the same zircon domains previously imaged by SIMS (CCFS Publications #407, 429). From our results (Fig. 1), it is evident that there is no correlation and that Pb is patchily distributed regardless of the degree of crystallinity.
From these results we conclude that there is no evidence that oxygen isotopes or REE in zircon were disturbed during the UHT metamorphism at 2.5 Ga. The reverse discordance in zircon from Gage Ridge, Mount Sones and Dallwitz Nunatak is related to ancient mobilisation of Pb and the most likely cause was polymetamorphism under dry conditions - two metamorphic events, one low-pressure at ca 2.8 Ga and a UHT event at ca 2.5 Ga.
This project is part of CCFS Theme 1, Early Earth, and contributes to understanding Earth’s Architecture.
Contacts: Monika Kusiak, Simon Wilde
Funded by: EU-FP7, Marie Curie grant
The enigma of chromitites in the upper mantle resolved
The mantle sections and the crust-mantle transition zones of many ophiolites contain bodies of chromitite, almost monomineralic concentrations of Cr- and Al-rich spinel. They are important economically as a source of chromium, and scientifically because these rocks encapsulate information on the nature of ancient upper mantle, young oceanic mantle, mantle melt formation and percolation processes, and on large-scale geodynamic emplacement mechanisms. 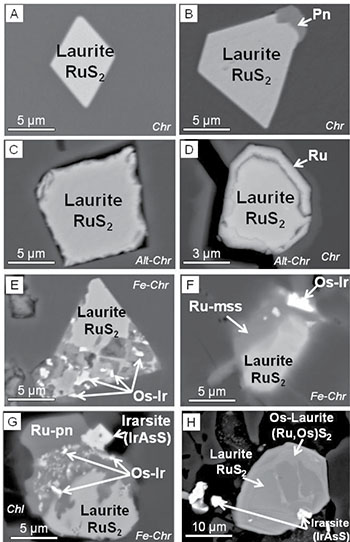
Figure 1. Backscattered electron images of Ru-Os sulfides and alloys from distinct microstructural positions in the Dobromirtsi chromitites. A and B: Primary (magmatic) laurite included in unaltered chromite. C and D: Partially corroded (secondary) laurite and Ru alloys in open fractures in chromite. E–G: Secondary assemblages showing distinct stages of alteration/replacement of laurite in ferrian chromite rims. H: Irregularly zoned laurite grain in the contact between a ferrian chromite rim and the interstitial matrix (for more details see CCFS Publication #42).
During the last four decades there has been a hot debate about the origin of these type of chromitites, yielding a huge number of studies with diverse and passionately defended hypotheses. Forensic-type studies of individual chromitite bodies in isolation have led to a profusion of genetic models indicating that chromitites from different localities formed by different mechanisms. These models can be grouped into three broad categories: (1) Fractional crystallisation of basaltic melts in magma chambers or conduits in the upper mantle or around the crust-mantle boundary. Variants of this model include changing the composition of the melt by an external process such as melt-rock reaction or assimilation of pre-existing mafic rocks. (2) Mixing or mingling of melts within dunite channels. (3) Separation of volatile-rich fluid phases with an important role for oxygen fugacity.
Among the questions that these models have been not able to resolve satisfactorily are: (1) how can chromium, a minor element in a peridotite-derived basaltic melt, be concentrated to produce large monomineralic bodies of chromite?; (2) how does a chromitite body start to nucleate and grow?; (3) what factors control the size of individual chromitite bodies?
A major breakthrough in our understanding of the genesis of the chromitites has come during the development of this research project, through the in situ analysis of Os isotopes by laser-ablation MC-ICPMS analysis of single tiny PGMs (and larger base-metal sulfides), which are usually found as inclusions in the chromitites. The Os-isotope composition of individual PGMs can now be directly related to their microstructural setting, internal structure and bulk composition (CCFS Publications #198, 334, 348, 349).
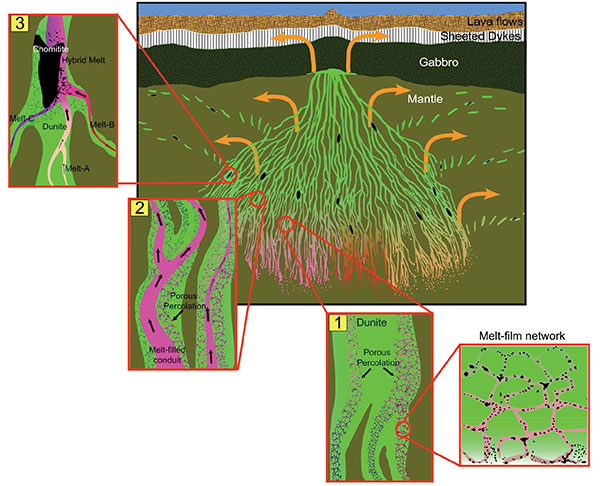
Figure 2. Formation of ophiolitic chromitites according to the new mechanism of crystallisation proposed in this work. A network of dunite channels drains melts ascending from different sources (marked with different colours) in the heterogeneous deeper mantle (modified from Kelemen, 2004). (1) Ascending melts move mainly by porous percolation through a melt-film network; in the zone of intersection between dunite channels mixing of basaltic melts with different SiO2 promotes precipitation of chromite. The image is not to scale, as grains of olivine are generally from < 0.5 mm to a few centimeters. (2) Focused flow of melt produces melt-filled channels in dunite allowing the chemical isolation and rapid ascent of the melts. (3) Chemically isolated melts drained through different channels in the dunite meet and mix to produce hybrid melts able to precipitate volumes of chromitite. The size of the dunite network and the chromitite bodies can vary from a few metres to many kilometers.
The observation that the primary Os-rich PGMs in the chromitites are highly heterogeneous in terms of Os-isotope composition, even at the scale of inclusions in an individual chromite grain, suggests that the chromitite formed by the mixing/mingling of multiple basaltic melts that sampled different mantle sources, and have undergone variable degrees of fractionation. In the exposed mantle sections of several ophiolites, meso- and micro-structures of chromite suggest that the intersecting melt-filled dunitic channels were draining ascending basaltic melts in a suprasubduction mantle. This is the ideal framework to produce chromitites by mixing of basaltic melts of different provenance and degrees of fractionation. In our new model, the formation of a chromitite body, its size and the type of chromitite microstructures, are inferred to reflect focused melt flow within these high-porosity and high-permeability networks of channels at different melt/rock ratios, and different temperatures of melts and host peridotite. Melt/rock ratio controls the amount of crystallising chromite and the chromitite microstructures. Moreover, the observation that many chromitites cross-cut their host peridotites suggest that mixing of melts at the intersection between melt-filled dunite channels is not the unique “physical” trap inducing crystallisation of chromitites. Also, in relatively cool mantle domains, chromitites may form in hydrofractures penetrating peridotites and infiltrated by interstitial chromite-bearing fluids. During these events of melt infiltration/injection, PGMs such as laurite or Os-Ir alloys already present in the mantle peridotite, or produced by the breakdown of PGE-bearing sulfides during the melt-rock reactions, can be also incorporated in a solid or crystal/melt mix into the parental melts of chromitites. This may explain why chromitites hosted in the mantle section of young ophiolites may contain PGM with Os-model ages > 2.5 Ga old.
On the other hand, the fact that some PGM grains in the chromitites are found along healed fractures cutting the primary chromite suggests that other populations of PGMs may have precipitated from metasomatic fluid/melts that infiltrated existing chromitites. The formation of this new generation of PGM can also explain the Os-isotopic heterogenity. The opening of the Os-isotopic system in PGMs associated with secondary chromite (produced by alteration of the magmatic chromite) also suggests that some PGMs that precipitated at mantle conditions, can be partly reacted and recrystallised during the infiltration of post-magmatic fluids. The recrystallisation of pre-existing PGM during polyphase metamorphism or “recycling” of the chromitite into deeper mantle levels can also explain the presence of micrometric PGMs with distinctly different Os-isotope compositions.
The results obtained in this project highlight the complex history that can affect the chromitites from their time of formation in the upper mantle, up to their surface emplacement. Chromitites may form at low pressures in the shallow mantle, but they can be later transported deep into the mantle (> 400 km) by subduction processes, and possibly integrated into the convecting mantle.
This project is part of CCFS Themes 2 and 3, Earth Evolution and Earth Today, and contributes to understanding Earth Architecture and Fluid Fluxes.
Contacts: José-María González-Jiminéz, Bill Griffin, Sue O’Reilly, Norman Pearson
Funded by: ARC ECSTAR Fellowship, ARC CoE CCFS Foundation Project 1 (TARDIS)
Transformation on Earth: the transition from ancient to modern Earth
Around 2.35 billion years ago (Ga), Earth’s atmosphere and near-surface hydrosphere underwent perhaps the most fundamental revolution in Earth history since the Giant Moon-Forming Impact at 4.5 Ga: the rise in the concentration of atmospheric oxygen. This was a revolutionary event because of the effects it had on ocean chemistry and weathering: the oceans were scrubbed of iron (and soon after, manganese) and rusting of ferrous minerals in the continents released sulfate (and other elements) to the oceans through oxidative weathering. The resultant change in ocean chemistry is reflected in the rock record, with the disappearance of banded iron formations and the appearance of sulfates and phosphorites from 2.45-2.2 Ga. Eventually, the rise of atmospheric oxygen led to the evolutionary development (or at least, widespread flourishing) of eukaryotes, a more complex life form that depends on the extra energy available from oxygen. The rise of atmospheric oxygen coincided with climatic cooling to the extent that glacial deposits appear for the first time on many continents.
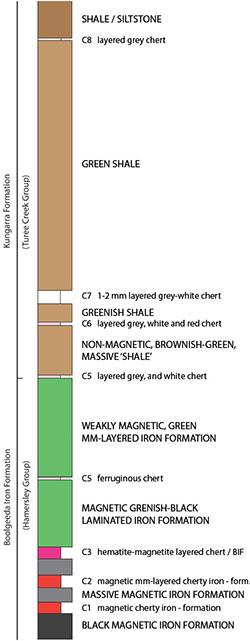
Figure 1. Stratigraphic section through the transition from the uppermost Boolgeeda Iron Formation of the Hamersley Group to the lowermost Kungarra Formation of the Turee Creek Group, here interpreted to occur at the base of the first non-magnetic unit. C1-C8 refers to chert layers from base to top across the section. (From Van Kranendonk et al., submitted).
Only a few rock successions on Earth are preserved from across this period of Earth history, and almost all of those are plagued by an incomplete record with one or more unconformities, which are horizons of non-deposition, and/or erosion, where the history of change was not recorded, or preserved. However, there is one succession where a continuous sedimentary record is preserved across this interval of extraordinary change – the Turee Creek Group of Western Australia. In this succession, which is up to 4 km thick, we recently discovered the transition from ancient to modern Earth, recorded in a sequence of alternating banded iron formation, shale and chert, all of which gradually become less iron-rich up-section, recording the gradual oxidation of ferrous iron dissolved in seawater (Fig. 1: Van Kranendonk et al., in review with Precambrian Research). Further up-sequence, the appearance of stromatolites and rippled sandstones denote the progressive infilling of the Turee Creek Basin, and above that, we have discovered two glaciogenic successions, each marked by a period of rapid sea-level fall, when seawater volume was transferred into the developing ice sheets, followed by rapid sea-level deepening, as the glacial ice sheets melted (Fig. 2: Van Kranendonk and Mazumder, in review with GSA Bulletin).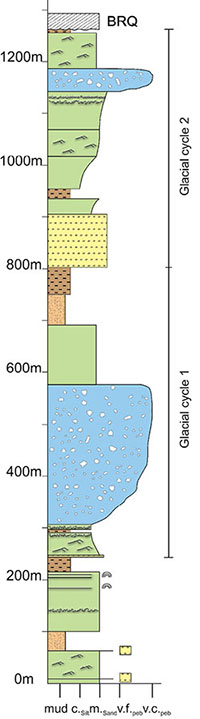
Figure 2. North (bottom)–south (top) stratigraphic section through the mid-upper Kungarra Formation on the northern limb of the Hardey Syncline, showing two distinct glacio-eustatic cycles.
In order to understand and quantify the nature of changes across this important interval, and to assess how the biosphere responded to this global climate change, Martin J. Van Kranendonk of the CCFS and his colleague from Paris, Professor Pascal Philippot, in collaboration with the Geological Survey of Western Australia, undertook a diamond drilling program to obtain fresh samples across each of the major transitions (Fig. 3). Three drill holes were obtained across different levels of the stratigraphy, including the basal contact with banded iron formations of the underlying Hamersley Group (ancient Earth), a full section through the lower of two glacial deposits and underlying stromatolites, and one through the upper part of the Turee Creek Group stratigraphy where the first sulfates might be expected to have been deposited, immediately above coastal to terrestrial sandstones of the Koolbye Formation (Mazumder et al., in review, Precambrian Research).
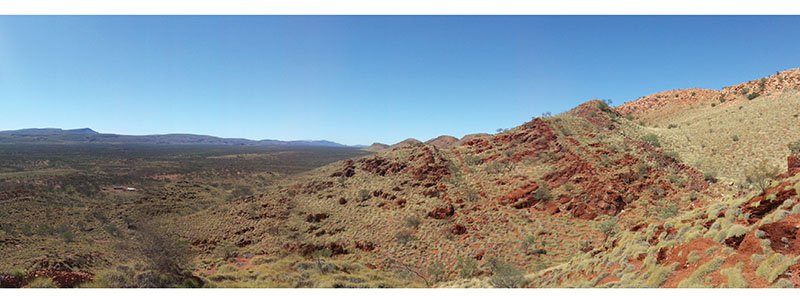
Figure 3. View looking over moderately dipping rocks of the Turee Creek Group, with the drillrig located on the flat ground in middle left. Lower slopes are glaciogenic diamictite.
Preliminary results of drillcore inspection reveal that stromatolites have been intersected at several levels, and pyrite, of both authigenic and detrital origin, is common throughout the succession (Fig. 4). The basal transition from banded iron-formation to non-ferruginous chert was successfully recovered. A team of scientists from around the world will be analysing the cores to unlock their secrets and reveal more about the evolution of the ocean reservoir and the biosphere across the Great Oxidation Event.
Figure 4. Left: Authigenic pyrite in fine-grained sandstone. Right: Rounded grains of detrital pyrite in medium-grained sandstone. Both views are 4 cm across.
This project is part of CCFS Theme 1, Early Earth, and contributes to understanding Earth’s Architecture and Fluid Fluxes.
Contact: Martin J. Van Kranendonk, University of New South Wales m.vankranendonk@unsw.edu.au
Funded by: The University of New South Wales, Institute de Physique du Globe de Paris, the Agouron Institute
Isotopes reunite lost relatives in western Australia
The Arunta Orogen of central Australia (Fig. 1) comprises a large part of the southern margin of the North Australian Craton and records episodic tectonic and thermal activity spanning almost 1.5 billion years of Earth’s history, from the Paleoproterozoic to the Devonian. The 1690–1630 Ma Warumpi Province forms the southernmost part of the Arunta Orogen and is separated from the older, 1860–1700 Ma Aileron Province to the north by the Central Australian Suture (Fig. 2a). Both are unconformably overlain by Neoproterozoic to Paleozoic basins.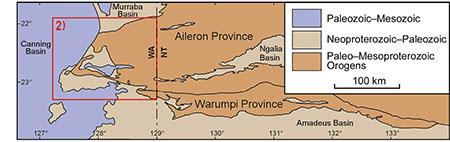
Figure 1. a) Location of the Warumpi Province on the southern margin of the Arunta region.
The Warumpi Province has been considered to be exotic to the North Australian Craton. However, Hf-isotope evidence for mixing between 1690–1630 Ma mantle-derived melts and older sources indicates that the history of the Warumpi Province involved interaction with significantly older crust of at least Mesoarchean age (Fig. 2b).
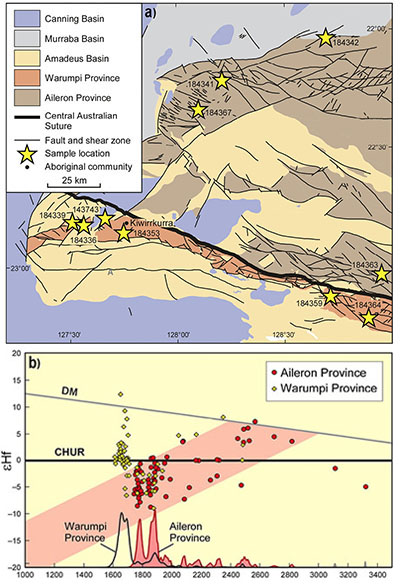
Figure 2. a) Simplified interpreted basement geology of the west Arunta region in Western Australia, showing the locations of analysed samples. b) εHf evolution diagram showing analyses of zircons from the Aileron (red circles) and Warumpi (yellow diamonds) Provinces. Probability density curves show the age distributions of Aileron Province (red) and Warumpi Province (unshaded) zircons. The light red field, which shows the crustal evolution of older components of the Warumpi Province, overlaps the compositional evolution of the Aileron Province, indicating a common source. See CCFS publication #436.
The ages and Hf-isotope compositions of inherited zircons in the 1677 Ma Pollock Hills Formation are consistent with this older crust being part of the Aileron Province. This suggests that the Warumpi Province represents a slice of Aileron Province crust rifted away from the southern margin of the North Australian Craton at, or prior to, 1690 Ma. The Warumpi Province then acted as a locus for the voluminous production of mantle-derived (juvenile) 1690–1660 Ma crust, both outboard of the southern Aileron Province margin, and during its accretion back onto the Aileron Province during and following the 1640–1635 Ma Liebig Orogeny.
Detrital zircons from Neoproterozoic units, including the Amadeus and Murraba Basins, which unconformably overlie the Aileron and Warumpi Provinces in the west Arunta region, record a history of distinct changes in erosional sources during their early depositional histories. Changes in detrital age components with stratigraphic level in the >840 Ma Kiwirrkurra Formation, the 1040–820 Ma Heavitree Quartzite, and the probably younger Munyu Sandstone, demonstrate marked changes from Warumpi-dominated to Musgrave-dominated detritus. This change in provenance over time probably relates to changes in tectonism in the region during the Neoproterozoic, possibly associated with breakup of the Rodinia supercontinent. See CCFS publication #436
This project is part of CCFS Themes 2 and 3, Earth Evolution and Earth Today, and contributes to understanding Earth’s Architecture.
Contacts: Chris Kirkland, Michael Wingate
Funded by: CCFS, GSWA
Tracking the birth and growth of the Central Asian Orogenic Belt
Most of the existing continental crust was generated by the end of the Archean (CCFS Publication #342), and the production of new crust has decreased markedly since that time (Belousova et al., Lithos 2010), except for some sporadic bursts of activity. One of these is the Central Asian Orogenic Belt (CAOB), a complex tectonic collage of microcontinental blocks, island arcs, and remnants of oceanic crust between the Siberian Craton to the north and the Tarim and North China cratons to the south. The CAOB is the world’s largest Phanerozoic accretionary orogenic belts and is the most important site for juvenile crustal growth in the Phanerozoic. The challenge is to unravel the major magmatic events in the generation of the juvenile crust from this Phanerozoic accretionary orogenic belt, and to answer several major questions. 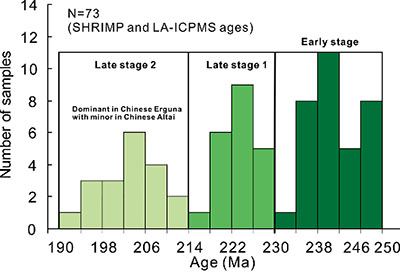
Figure 1. Histogram of Early Mesozoic zircon U-Pb ages in the CAOB. Only SHRIMP and LA-ICPMS zircon U-Pb data are used.
Why was the CAOB the locus of such extensive juvenile crustal growth in Phanerozoic? Is this related to the massive amount of oceanic crust that was subducted during closure of the Paleo-Asian Ocean, to subduction of the Mongol-Okhotsk arcs, or to the Siberian mantle plume? What was happening at the different continental margins (e.g. Siberian margin and North China Craton margin)? Was the pre-existing Paleozoic accretionary crustal architecture modified largely by Mesozoic magmatism? Our recent work (Li et al. Earth-Science Reviews, 2013, Wang et al. American Journal of Science, 2014) is beginning to provide plausible answers to these questions, from detailed regional geological, petrological and geochronological studies on the subduction-related, collision-related and intraplate extensional magmatism in the CAOB, tracing granite sources and origins to pinpoint crustal architecture and growth in the Early Mesozoic.
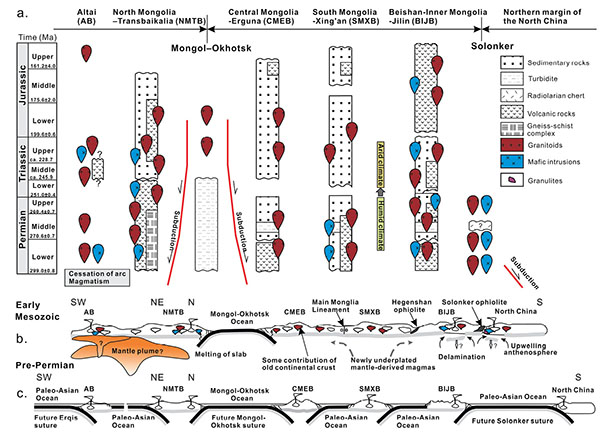
Figure 2. (a) Schematic space-time diagram showing major tectonic events affecting each belt in the CAOB. (b) Pre-Permian and (c) Early Mesozoic cross-section showing schematically the oceanic and arc/continent domains.
The numerous Early Mesozoic granitoids in the CAOB can be broadly classified into two groups on zircon U–Pb ages (Fig. 1): an early group from Early to Middle Triassic (250–230 Ma) and a late group emplaced during Late Triassic and Early Jurassic time (230-190 Ma). Early (250-230 Ma) granitoids are mainly distributed in the western Central Mongolia–Erguna Belt (CMEB), the western Altai Belt (AB), the South Mongolia–Xing’an Belt (SMXB) and the Beishan–Inner Mongolia–Jilin Belt (BIJB). They are mainly quartz-diorites, granodiorites and monzogranites, mostly of I-type, with minor mafic intrusions; some have adakite-like signatures and S-type features. Late (230-190 Ma) granitoids mainly occur in the North Mongolia–Transbaikalia Belt (NMTB), the eastern CMEB (Erguna massif) and the eastern Altai Belt (AB). They are mainly syenogranites, monzogranites and syenites, associated with many alkaline granites and mafic intrusions and are A-type and transitional I–A type or highly fractionated I-type granites.
Whole-rock Sr-Nd and zircon Hf isotopic data have been compiled for regional isotopic mapping. The εNd(t) values show large variations from −7.0 to +7.4 and Nd model ages (TDM) from 0.46 Ga to 1.43 Ga; the initial Sr isotopic ratios (Sri) range from 0.7023 to 0.7174. The zircon εHf(t) values vary from -4.6 to +15.3 and give two-stage Hf model ages (TDM2) from 0.30 Ga to 2.09 Ga. The extremely large variations of whole-rock Sr-Nd and zircon Hf isotopes imply heterogeneous source regions mainly dominated by juvenile components but with significant older crust as well. In the CAOB, the isotopic signatures (Nd-Hf) of the Early Mesozoic granitoids are similar to those of the Paleozoic granitoids in the same belt, indicating the Early Mesozoic crustal architecture retained its original Paleozoic continental signatures, which had not been modified by much juvenile mantle-derived material.
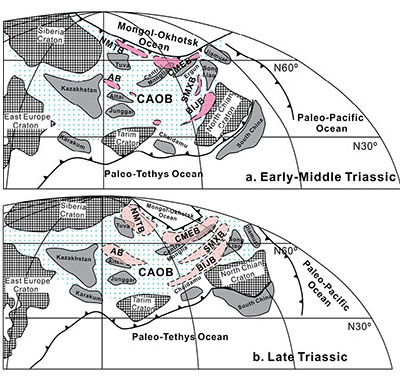
Figure 3. Schematic paleogeographic reconstruction of the Early Mesozoic ocean-continent framework of the CAOB and adjacent regions. The pink areas broadly represent the Early-Middle Triassic (a) and Late Triassic (b) granitoid belts in the CAOB.
The older continental terrane was not thrust onto, or subducted beneath, the younger juvenile accretionary terranes, as seen in some collisional orogens. The crustal architecture in the CAOB is typical of an accretionary orogen that is characterised by horizontal accretion, not by vertical superposition of terranes. In contrast to the generation of massive juvenile crust in the Paleozoic accretionary stages of orogenic development, crustal recycling plays a more substantial role in the post-accretionary stages.
The generation of the Early Mesozoic granitoid magmas in the NMTB and the CMEB was dominated by the ongoing closure of the Mongol-Okhotsk Ocean and some were probably related to a mantle plume (Fig. 2). They may have been derived from melting of subducted materials or juvenile components with some probable contributions from ancient continental crust. Early Mesozoic granitoid magmas in the SMXB, the AB and the BIJB were generated in a post-/non-orogenic setting after the closure of the Paleo-Asian Ocean and were the results of partial melting of crustal components in response to underplating of mantle-derived magmas, most likely linked to lithospheric thickening, delamination and asthenospheric upwelling (Fig. 2). Early Mesozoic granitoid magmatism provides critical information on the Mesozoic post-accretionary tectonic evolution of the Paleo-Asian Ocean and transitional tectonic regimes from Early Mesozoic subduction to Late Mesozoic closure of the Mongol-Okhotsk Ocean as well as post-accretionary continental growth (Fig. 3).
This project is part of CCFS Themes 2 and 3, Earth Evolution and Earth Today, and contributes to understanding Earth’s Architecture.
Contacts: Shan Li, Tao Wang, Simon Wilde
Funded by: National Basic Research Program of China, National Natural Science Foundation of China, China Geological Survey
Ghosts of oldest bacterial colonies haunt Western Australia
Identifying and reconstructing Earth’s earliest biosphere is challenging. Earth’s oldest sedimentary rocks are not only rare, but almost always have been heated and deformed by tectonic activity so that former signs of life are destroyed or modified beyond recognition. A new study, however, has revealed the well-preserved remnants of a complex bacterial ecosystem in a 3.5 Ga sedimentary sequence from the Pilbara region of Western Australia (CCFS publication #365).
The ancient core of the Pilbara terrane constitutes one of the rare geological areas that provide insights into the early evolution of life on Earth. Mound-like deposits (stromatolites) created by ancient bacteria, and rare microfossils of bacteria, have previously been described from this region. However, a phenomenon called microbially induced sedimentary structures, or MISS for short, had not previously been seen in rocks of this great age. Before our discovery the oldest MISS were ~ 3.2 billion years old.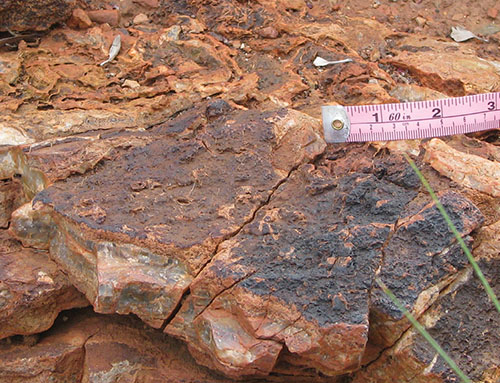
Figure 1. Microbial mat on rock surface from the 3.48 billion year old Dresser Formation, Pilbara, Western Australia.
MISS are created by communities of microorganisms, living in microbial mats, as they respond to changes in physical conditions such as erosion or sediment deposition in their immediate environment. A common example would be the binding together of sediment grains by microbes to prevent their erosion by water currents. MISS demonstrate not only the presence of life, but the presence of whole microbial ecosystems that could co-ordinate with one another and influence their environment.
eroded fragments of microbial mat, are on the millimetre to metre scale and can be seen with the naked eye. Other MISS are microscopic and typically include remnants of microbial filaments wrapping around sediment grains, or miniature versions of tufts (Fig. 2) and mat fragments. We have found at least ten distinct types of MISS from the 3.48 Ga Dresser Formation and demonstrated their close similarity in both morphology and preservation style to MISS found in the younger geological record. We also found that the structure and isotopic composition of carbon preserved in these MISS are consistent both with a biological origin and the known age of the samples.
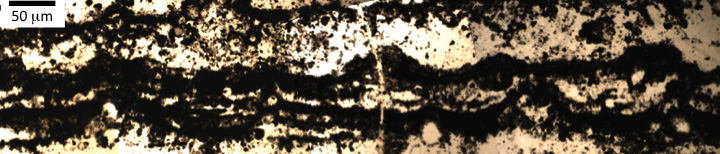
Figure 2. Cross-section through a tufted microbial mat from the Dresser Formation, viewed down the petrographic microscope. The black material is carbon and pyrite.
MISS come in varied shapes and sizes. Some, such as crinkles and tufts on rock surfaces (Fig. 1), and As well as extending the geological record of MISS by almost 300 million years, our work shows that relatively complex mat-forming microbial communities probably existed almost 3.5 billion years ago. While it is arguable whether these MISS are the earliest signs of life on Earth, they certainly provide a new and robust source of evidence showing that large volumes of organisms were alive and well in these inhospitable conditions on the early Earth.
New discoveries of ancient life on Earth such as these can also be informative for the search for life on other planets, since the early histories of Earth and Mars are thought to have been similar. MISS could now be considered a prime target for Mars rovers, especially given that some MISS are of the centimetre scale and larger and may be visible to a rover camera.
This project is part of CCFS Theme 1, Early Earth, and contributes to understanding Earth’s Fluid Fluxes.
Contact: David Wacey
Funded by: ARC CCFS CoE
Trace elements in olivine are scouts for subducted continental crust in the source regions of magmas
Oceanic crust produced by sea-floor spreading at mid-ocean ridges is returned to the mantle by the process of subduction. This can be recognised by geophysical measurements that image sloping blocks of ocean crust beneath the surface, diving down beneath deep-sea trenches. For thirty years now, it has been debated how deeply these blocks are thrust into the mantle, and it is widely believed that some of this material reappears as chemical components in ocean islands such as Hawaii – thousands of kilometres from the position of any current subduction zone.
However, models for this recycling of crust usually deal with the basalts and gabbros that make up a thickness of about
7 km above the main mass of the ocean plate. It is much more difficult to characterise the recycling of the few hundred metres of sediments that were deposited on the ocean crust after its formation or during the collision process. Trace-element and isotopic compositions of volcanic rocks directly above the subduction zone indicate sediment subduction in some places, but in others the sediments are probably completely scraped off in the collision process, and do not follow the slab down into the subduction zone. The volumes of sediment involved are too small for the geophysical measurements to see.
Trace elements in olivine are a promising tool to solve this dilemma. Abundances of trace elements such as nickel, cobalt and manganese have been used to suggest the presence and melting of olivine-free rocks that originated from recycled oceanic crust beneath ocean islands (Sobolev et al., 2007, Science), but alternative explanations for these elements have also been put forward. No indicator for continental crust has been proposed as yet.
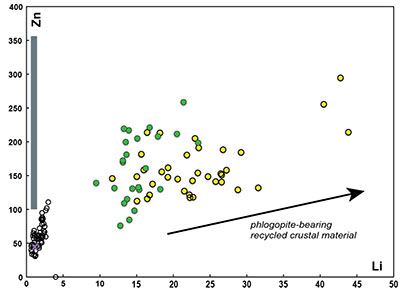
Figure 1. Both Li and Zn are enriched in olivines in Mediterranean post-collisional volcanic rocks (yellow and green circles) from source regions containing recycled continental crust, which is present in the source as phlogopite-bearing assemblages. Hawaiian olivines from sources containing recycled ocean crust lie in the grey box with variable Zn but low Li (1-2 ppm). Mantle olivines have almost exclusively less than 6 ppm lithium. From Foley, Prelevic, Rehfeldt and Jacob (2013) Earth and Planetary Science Letters Frontiers.
Our recent measurements in post-collisional volcanic rocks in the Mediterranean area have changed this. Many crustal blocks around the Mediterranean formed by a different subduction process, one that involved the collision and scrunching together of small ocean basins and blocks of continental crust – there is no deep subduction involved. These blocks are imbricated together and, after the lateral collision stops, the crust and lithosphere rise and melt, resulting in volcanoes that erupt 20-40 million years after collision ceases. These volcanic rocks contain large olivine crystals; some crystallised as the first minerals from the melts, and others were already present in the mantle and were torn off by the passing melt. These olivines have high concentrations of lithium and zinc (Fig. 1) - ten times as much lithium as is typical for mantle olivines, but similar to abundances seen in continental sediments. Coupled with previous results for lead isotopes in the volcanic rocks, which indicated input from continental crust, these lithium analyses in olivine clearly demonstrate the involvement of subducted continental sediments in the source regions of the melts. This process is widespread; the yellow points in Figure 1 are from Spain in the western Mediterranean, whereas the green points are from as far east as Turkey.
We will be pursuing research on this theme in the CCFS. The next questions are: [1] What are the olivines really “seeing”? We suspect that the lithium is concentrated by the formation of a different, intermediate rock type rich in mica and pyroxene, and this is what the olivines are really scouting for. [2] How important was subduction of continental crust earlier in Earth history? The suspicion here is that the accretionary type of collision involving small oceans and continental blocks, now seen in areas such as the Mediterranean and Indonesia, was much more widespread in the Archean, before all the continents had been formed.
This project is part of CCFS Theme 2, Earth Evolution, and contributes to understanding Earth’s Fluid Fluxes.
Contact: Stephen Foley
Funded by: Geocycles Research Centre, University of Mainz - State of Rhineland Palatinate (Germany)
Auditioning zircons for perfecting performance
Zircon is a common U-rich accessory mineral recognised as a key geochronometer and premier geochemical tracer in terms of Hf and O isotopes because of its resistance to alteration and post-magmatic metamorphism. However, zircons with high uranium (U) contents commonly yield anomalous older apparent ages in ion microprobe analysis (commonly called the “high-U matrix effect”) (White and Ireland, Chem Geol, 2012). Moreover, zircons with such discordant U-Pb ages usually also have disturbed oxygen-isotope compositions (Booth, GCA, 2005). Although these isotopic disturbances are commonly considered to be due to zircon metamictisation (the destruction of the crystal lattice by radiation damage), the discussion of data quality has mostly been qualitative. It is difficult to define a specific minimum U content that causes the “high-U matrix effect” or metamictisation, because the radiation damage is accumulated through time. This qualitative evaluation also has led most workers to overlook the different stability of zircon’s U-Pb isotope system and oxygen-isotope system. For zircons in which the U-Pb system remains apparently undisturbed, the robustness of the oxygen isotope data is rarely questioned. 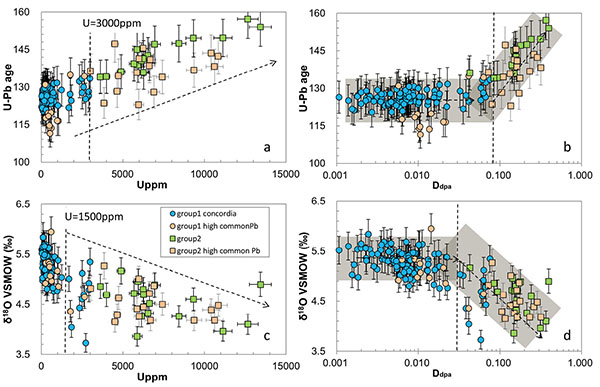
Figure 1. Raman spectra of zircons with different Ddpa values.
Raman spectra show that zircons with increasing degrees of radiation damage have gradually changing peaks and higher values of half-width height (Fig. 1), and the effects of radiation damage can be quantified, as displacements-per-atom, Ddpa (Palenik, Am Mineral 2003). We have used this technique to assess the effect of varying U contents on the ion microprobe U-Pb and oxygen isotopic signatures of zircon-quartz pairs from the U-rich A-type granites of Suzhou (southern China). The results show that zircons with U concentrations ([U]) greater than 1500 ppm show a negative correlation between [U] and δ18O values, while zircons with [U] greater than 3000 ppm show a positive correlation between [U] and U-Pb ages (Fig. 2). Oxygen-isotope analyses of coexisting quartz provide constraints for interpretation of zircon oxygen-isotope values, because the isotopic partitioning between quartz and zircon is well known. This relationship allows us to recognise anomalous δ18O values (Fig. 3), which are clearly common in high-U zircons.
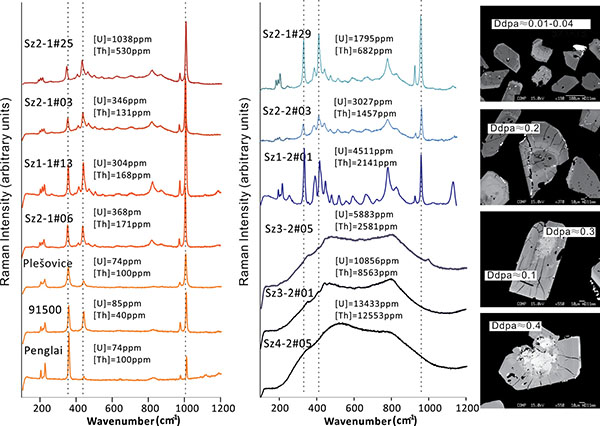
Figure 2. Plot of zircon U (or Ddpa) vs 206Pb/238U age (or δ18O); In-situ zircon U-Pb age and δ18O data are obtained from SIMS analysis.
The high U contents of the zircons thus produce two independent effects, linked by the radiation damage. Anomalously high SIMS U-Pb ages are a direct result of the matrix effect caused by metamictisation, whereas the low δ18O values result from interaction with infiltration of OH-bearing fluid and fluid-facilitated diffusion in the radiation-damaged areas. Previous oxygen-isotope studies of bulk zircon separates from the Suzhou granites reported low δ18O ratios; it is now clear that these represent anomalous values due to effects of radiation damage to the zircons.
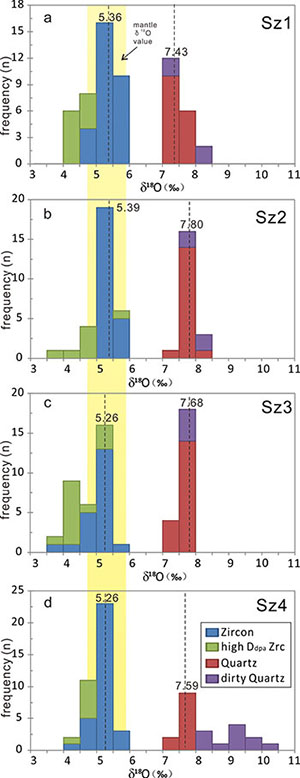
Figure 3. Histograms of δ18O values for zircon-quartz pairs from the four representative Suzhou granite samples
This study shows how essential it is to evaluate the degree of radiation damage before/after carrying out dating or oxygen-isotope analysis on zircons with high U contents. Raman spectroscopy can be used to measure the degree of radiation damage of zircons, but, it is not always available, especially for pre-existing data and data from the literature. In the absence of Raman spectra, Ddpa calculated from the [U], [Th] and age can be used to estimate the highest degree of radiation damage and screening for reliable zircon U-Pb geochronology and oxygen isotope analysis (Fig. 4). The results indicate that for the Suzhou pluton, Ddpa <0.03 is a robust discriminant threshold to identify zircons with primary oxygen-isotope ratios and Ddpa<0.08 is a robust discriminant to screen for reliable U-Pb dating. These different screening values reflect the evidence that oxygen-isotope compositions show disturbance at a lower level of post-crystallisation zircon lattice disturbance than does the U-Pb system.
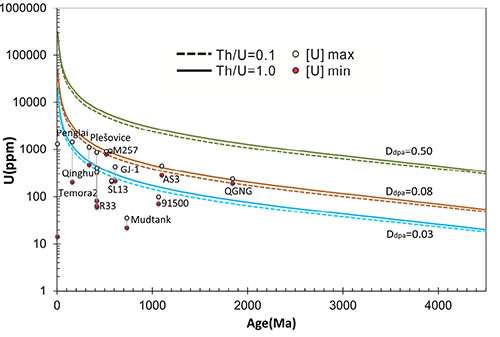
Figure 4. Correlation between U concentration and U-Pb ages, along with assigned Ddpa of 0.03, 0.08, and 0.5. Dashed lines Th/U = 0.1; solid lines Th/U = 1. The area between dashed and solid lines with same Ddpa, including all the zircons with Th/U = 0.1 ~ 1. Data sources for standard zircons: Penglai – Li, Geost. Geoan. Res, 2010; Qinghu – Li, Sci China Ser D, 2009; Plešovice – Slama, Chem Geol, 2008; Temora – Black, Chem Geol, 2003; R33 – Black, Chem Geol, 2004; M257 – Nasdala, Geost. Geoan. Res, 2008; SL-13 – Lee, Nature, 1997; GJ-1 – Jackson, Chem Geol, 2004; Mud tank – Black and Gulson, BMR J Aust Geol Geophys, 1978; 91500 – Wiedenbeck, Geostandards Newsletter,1995; AS3 – Paces and Miller, JGR,1993.
This project is part of CCFS Theme 2, Earth Evolution, and contributes to understanding Earth’s Architecture and Fluid Fluxes.
Contacts: Yuya Gao, Xian-Hua Li (P, IGGCAS, Beijing), Bill Griffin
Funded by: EPS postgraduate fund, iMQRES, MQ PGRF, CCFS, IGGCAS
Why hasn’t the Mediterranean Basin closed?
The Mediterranean Sea is the vestige of a large ocean that was closed by the northward movement of the African plate, creating the Alps as the leading edge of the African plate was subducted beneath Europe. But why did it stop there? Why does the Mediterranean exist at all? A growing body of data on U-Pb ages of magmatic zircons, Hf model ages of inherited zircons and whole-rock Nd model ages of crustal igneous and metamorphic rocks has provided many constraints on crustal evolution within the Mediterranean basin. However, there has been little robust information on the age of its underlying mantle, that would allow us to understand the deeper geological framework of the Mediterranean.
A synthesis of Re-depletion model ages (TRD) for both whole-rock samples and in situ analyses of individual sulfides from mantle-derived rocks, including xenoliths and peridotite massifs that are widespread across the Mediterranean area, demonstrates the existence of different mantle domains (CCFS Publication #234). A maximum TRD age of 1.8 Ga is common to sulfides in mantle-derived peridotite xenoliths beneath Western Europe (Calatrava Volcanic Field, Spain; Languedoc and Massif Central, France) and to whole-rock samples from Azrou (North Africa) and the Pyrenees (France). A maximum at <1.4-1.3 Ga is seen in whole-rock samples from Central Europe (Bohemian and Rhenish Massifs) as shown in Figure 1. 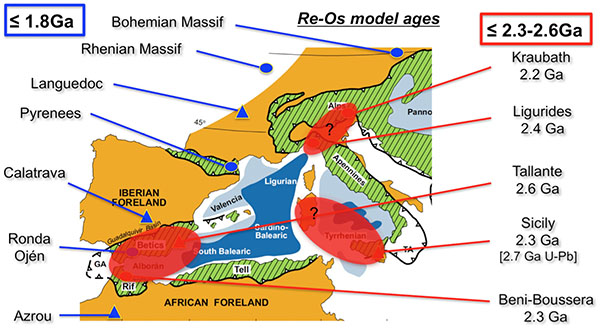
Figure 1. Distribution of maximum TRD model ages across the Mediterranean region. The tagged line represents the Maghrebide-Appenine-Betic tectonic front. Red areas indicate possible Archean micro-plates.
In contrast, Os-bearing sulfides in xenoliths and sulfides and platinum-group minerals in peridotite massifs from the inner Mediterranean region (Hyblean Plateau in Sicily and Kraubath Massif in Austria) all show an oldest TRD peak at ~ 2.3 Ga, equivalent to the oldest whole-rock TMA of 2.2 Ga for rocks of Beni Boussera in northern Morocco and the 2.4 Ga peak in sulfides from peridotites of the internal Ligurides (Italy). A peak at 2.6 Ga is defined by sulfides in mantle xenoliths from the Tallante Volcanic Field in southern Spain.
These Re-Os data identify the existence of a common Paleo-Proterozoic (1.8 Ga) mantle on both sides of the Mediterranean realm, and an older (2.2-2.6 Ga) lithospheric mantle sitting inside the more recent Maghrebide-Appenine-Betic front generated during the Alpine-Betic orogeny. Thus, the Mediterranean basin may contain several buoyant Archean microplates, which could act like bollards, impeding the northward movement of Africa, and protecting the Mediterranean from closing.
This project is part of CCFS Themes 2 and 3, Earth Evolution and Earth Today, and contributes to understanding Earth Architecture and Fluid Fluxes.
Contacts: José María González-Jiménez, Bill Griffin, Sue O’Reilly
Funded by: CCFS ARC ECSTAR funds
Surface structures influence reaction rates of minerals
The rate at which minerals are dissolved and grow is crucial in our understanding of how Earth materials have changed in terms of physical and chemical properties through time. In recent years, it has been realised that many reactions that transform one mineral to another require fluid involvement. The first and often crucial step in this transformation is dissolution.
We have investigated the dynamics of dissolution and the time evolution of the (often assumed) parameter, dissolution constant, that determines at which rate a mineral dissolves under specific conditions. Classically, dissolution rates are calculated based on models of dissolution kinetics as a function of surface area, which is assumed to remain constant. However, this assumption ignores the changes occurring on the surface during the dissolution process. We examined how the topography of natural fluorite surfaces with different crystallographic orientations changed during up to 3200 hours of dissolution. The results were analysed in terms of changes in surface area, surface reactivity and dissolution rates.
We found that the dissolution rate is strongly time-dependent, while the value of the dissolution constant varies depending on the crystallographic orientation of the dissolving surface. All surfaces studied show rapid changes in topography and rapid dissolution rates during the initial 200 hours of dissolution. The factors controlling the development of topography are the stability of the step edges forming the initial surface and its inclination to the closest stable planes, which are specific for each surface orientation. The surface dynamics are accompanied by a significant decrease of dissolution rates after the initial rapid-dissolution regime. The time-dependent variation of dissolution rates is attributed to a decrease in the density of step edges on the surface and the continuously increasing exposure of more stable planes with time. During a second dissolution regime, some surfaces continue to show significant changes in topography, while on others the topography tends to remain approximately constant.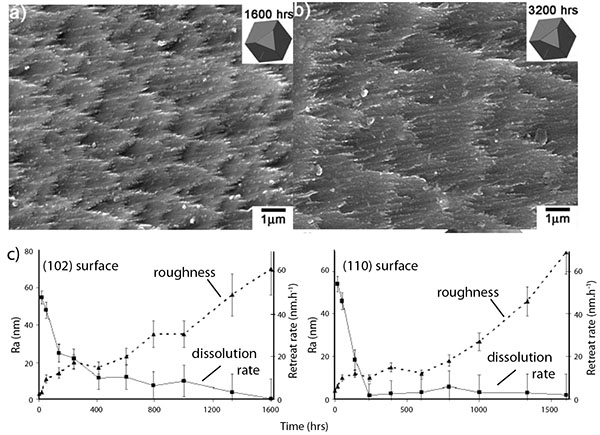
Change in dissolution rate, surface structure and topology / roughness as a function of time and surface orientation. (A) & (B) Examples of SE images showing topography of one studied surface after 1600 hrs and 3200 hrs dissolution. (C) Graphs showing that dissolution rates are initially high, while roughness/topography is low, subsequently dissolution rates decrease while roughness / topography increases. Two examples are shown, (left) surface (102), (right) surface (110).
Our observations suggest that the development of topography during the initial dissolution regime is kinetically driven, and therefore the surface may only reach a metastable state. The height and size of the topographic features initially developed, and the types of planes and step edges that constitute them, determine the changes during the second dissolution regime. Dissolution transforms the metastable surfaces formed during the initial dissolution stage towards a more stable topography. Importantly, our results show that, contrary to classic theory, dissolution rates decrease even though the total surface area increases. Therefore, calculations of dissolution rates that assume dissolution rates are directly proportional to surface area are not valid for the surfaces studied. Instead, to develop accurate kinetic-dissolution models and more realistic stochastic dissolution simulations the surface reactivity, as determined by the relative stability of the planes and type of edges that constitute a surface, must be taken into account.
Even though experiments were performed using fluorite, the same principles are predicted to hold for other crystal structures. This study may be the first step toward a quantitative characterisation of the often heterogeneous, fluid-mediated replacement of different minerals in the Earth’s crust and Mantle (see CCFS publication #364).
This project contributes to the CCFS Theme 3, Earth Today, and furthers our understanding of Earth’s Fluid Fluxes.
Contact: Sandra Piazolo
Funded by: ARC Future Fellowship, European Research Council
Different continent configurations around 800 – 500 million years ago give new clues about extreme climatic variations
The Neoproterozoic was one of the most dynamic times in Earth history, featuring the formation and breakup of the supercontinent Rodinia (e.g. CCFS contribution #117), repeated low-latitude glaciation at sea level (a Snowball Earth?), rapid oxidation of the atmosphere, and the end of the Precambrian explosion of complex life. To better understand the relationships between these dramatic events, we developed a set of revised global palaeogeographic maps for the 825–540 Ma time interval, accompanied by a compilation and graphical illustration of global data on sedimentary facies (CCFS contribution #314; see Fig. 1 for examples). These maps form the basis for an examination of the relationships between known glacial deposits, paleolatitude, positions of continental rifting, relative sea-level changes and major global tectonic events such as supercontinent assembly, breakup and superplumes. 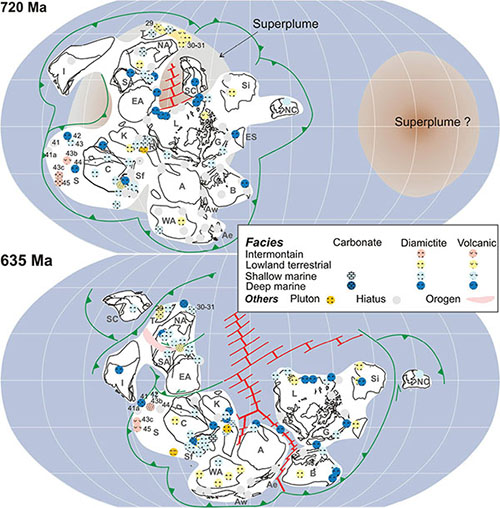
Figure 1. Revised global palaeogeographic reconstructions for 720 Ma and 635 Ma, with facies distributions featuring the occurrence of the “Sturtian” (ca. 720 Ma) and “Marinoan” (ca. 635 Ma) glaciations, respectively.
Our analysis reveals several fundamental palaeogeographic features that will help inform and constrain models for Earth’s climatic and geodynamic evolution during the Neoproterozoic. First, whereas the latitudinal distribution of carbonate rocks appears to be in accord with a normal zonal global climate similar to that of the Phanerozoic (Fig. 2c), thus validating the palaeogeographic maps, glacial deposits at or near sea level appear to extend from high latitudes into the deep tropics for all three Neoproterozoic ice ages (720 Ma, ca 635 Ma, and ca 580 Ma), although the 580 Ma interval remains very poorly constrained in terms of both paleomagnetic data and global lithostratigraphic correlations (see Figs. 1 and 2b for latitudinal distributions of all three glacial events). This appears to be consistent with the predictions of the Snowball Earth model (e.g. Hoffman et al., 1998). Second, continental sedimentary environments were dominant in epicratonic basins within Rodinia (from >825 Ma to 750 Ma; Fig. 2a shows the low proportion of deep-marine facies for that time), possibly resulting from both plume/superplume dynamic topography and lower sea-level due to dominantly old oceanic crust. This was also the case at ca 540 Ma (Fig. 2a), but at that time the pattern reflects widespread mountain ranges formed during the assembly of Gondwanaland and the increasing mean age of global ocean crust. Third, deep-water environments were dominant during the peak stage of Rodinia break-up between ca 720 Ma and ca 580 Ma (Fig. 2a), probably indicating a higher sea level due to increased rate of production of newer oceanic crust, and perhaps the effect of continents drifting away from a weakening superplume. Such a geodynamic control of first-order global sea-level changes has also been observed during the evolution of the youngest supercontinent Pangaea (e.g. Muller et al., 2008 ), and agrees well with the hypothesised dynamic supercontinent-superplume coupling (see Li and Zhong PEPI, 2009 for a review of the model). Finally, there is no clear association between continental rifting and the distribution of glacial strata, contradicting models that restrict glacial influence to those particular tectonic environments. 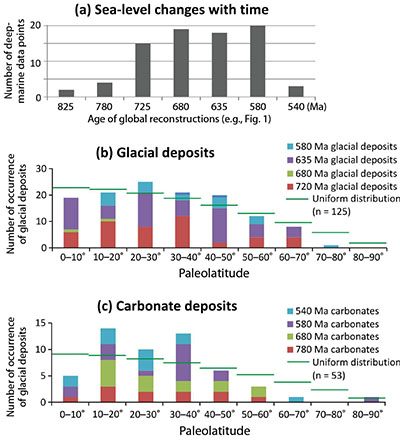
Figure 2. (a) Variations in the number of data points showing deep marine environments among seven palaeogeographic snap shots. (b) Paleolatitudinal distribution of glacial deposits, and (c) paleolatitudinal distribution of carbonate deposits according to the revised palaeogeographic reconstructions with facies distributions (see Fig. 1 for example).
This project is part of CCFS Theme 2, Earth Evolution, and contributes to understanding Earth’s Architecture.
Contact: Zheng-Xiang Li
Funded by: CCFS Foundation Project 6
The first Martian crust
Mars is the closest planet to Earth after the Moon and mankind has long speculated about possible life on Mars. The science-fiction novels from the ‘fifties depicting human colonies on the red planet certainly fed this curiosity and contributed to the modern development of the small robots now roving the surface of Mars (like NASA’s Opportunity and Curiosity). These remotely-controlled rovers have been providing stunning images and data from the Martian surface and have massively improved our knowledge of the planet. The other way we can study Mars is by finding and collecting meteorites, first launched from its surface during impacts, and then delivered to Earth. While the rovers and their range of high-tech instruments concentrate on the study of the surface, Martian meteorites provide insight into the deeper part of the planet. Most of them are mafic and ultramafic rocks originating either from the mantle or from the young volcanic plains covering the northern hemisphere of Mars. The southern hemisphere of Mars, known as the Southern Highlands, is believed to be much older and to hold clues to the planet’s early differentiation. Yet, so far, no samples are available from this part of the planet. 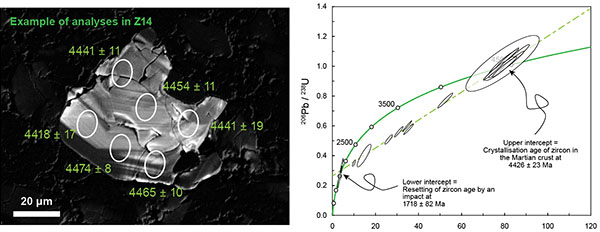
A Martian meteorite recently recovered from the north-western African desert and called NWA 7533 is strikingly different from the other known Martian meteorites: it is a fragment of Mars’ regolith breccia, comprising a fine mixture of fragments of igneous rocks and clast-laden impact melt. Superficially, it appears quite similar to some Apollo samples but has the unique Martian compositional signature (as identified by oxygen isotopes). It also contains (i) high abundances of meteoritic siderophile elements (like Ni and Ir) suggesting it formed as a result of impact and (ii) fine-grained material with composition similar to soil analysed from the Gusev crater by the Spirit rover, suggesting the meteorite mainly consists of soil particles; hence its classification as a regolith breccia. NWA 7533 also contains small magmatic clasts, enclosing zircon grains.
Our part in this exciting project was to image and date these zircon grains, achieved by in situ U-Pb dating using the SHRIMP (ion microprobe) in the John de Laeter centre at Curtin University. The small meteorite slab we studied contained seventeen zircon grains; ten were large enough to be dated, and seven grains, representing eighteen ion-microprobe analyses, could be combined to define a Discordia line. The upper intercept age at 4426 ± 23 Ma (million years) is interpreted as the crystallisation age of the zircon grains. The lower intercept age at 1718 ± 82 Ma represents the time where the U-Pb system was disturbed, most likely by an impact. The discovery of such ancient zircon grains on Mars implies that the planet’s early crust differentiated at about the same time as the Earth and the Moon crusts ( CCFS Publication #370 ). This is of particular interest as it may point toward a similar mechanism for the differentiation of terrestrial planets, regardless of their present shape and overall mass.
This project is part of CCFS Themes 1, Early Earth, and contributes to understanding Earth’s Architecture.
Contacts: Alexander Nemchin, Marion Grange
Funded by: CCFS (Marion Grange salary)
Tracking deep fluid processes where continents collide: magmatic segregations in a Tibetan orogenic peridotite
Arc magmatism in subduction zones is a prime process controlling element recycling and continental growth at the convergent margins in the shallow Earth, but the early stages of magmatic processes at mantle depths remain unclear. Many previous studies have shown an andesitic average for the composition of the continental crust in contrast with the basaltic nature of primitive melts in plate collision zones, suggesting there is a complementary rock-type component at depth. Mafic to ultramafic pyroxenites hidden within the arc roots have been suggested as this complement (e.g. Kay and Kay, GCA 1988; Dhuime et al., J Pet. 2009). Thus, knowledge of the genesis and sources of these “hidden” pyroxenites is critical to understanding the dynamic processes of generation and migration of primitive arc magmas beneath active margins, and to linking the recycling of material between subduction slabs and erupted volcanics within a complete framework of plate convergence. This study examines the origin and history of pyroxenite dykes (interpreted to be magmatic segregations; Fig. 1) in the Shenglikou peridotite massif (North Qaidam Orogen, NE Tibet, China).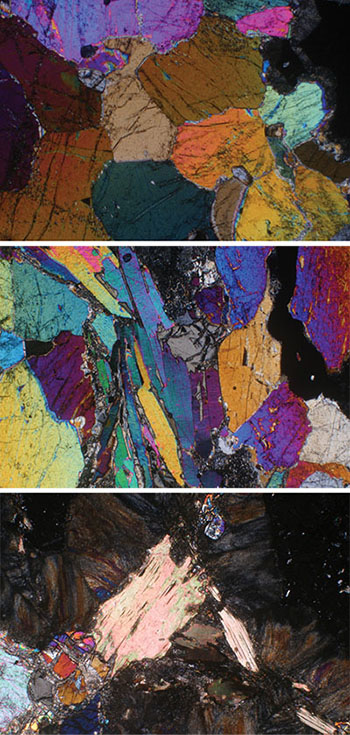
Figure 1. Thin-section photomicrographs of the Shenglikou pyroxenites, North Qaidam, NE Tibet.
Major- and trace-element compositions of the pyroxenites indicate an origin as high-pressure (garnet-facies) cumulates and/or trapped melts, and the derivation of the parental magmas from the melting of a deep peridotite-dominated source. Bulk-rock trace-element patterns also show strong enrichment in fluid-mobile elements (Cs, Rb, Ba, U, Pb and Li) and marked negative anomalies in the high-field-strength elements relative to rare earth elements; overall they are geochemically similar to melts from a volatile-rich arc-type mantle. Initial Sr isotopic ratios (0.7152-0.7105) and Nd isotopic compositions (εNd(t) = -11.6 to -4.4) of clinopyroxene and garnet confirm the contribution of subducted sediments. However, the Hf isotopes of clinopyroxene, garnet and zircon show depleted-mantle isotopic values at 430 Ma; one garnet sample with depleted-mantle model age of 846 Ma shows minimum assimilation of the host peridotite during the pyroxenite intrusion. Oxygen isotopic signatures of garnet and zircon imply uncontaminated upper-mantle sources. These decoupled isotopic features further suggest that the melt source was a peridotite-dominated convective mantle wedge (controlling the Hf and O isotopes) that had been pervasively metasomatised by fluids from the subducted slab (controlling the Sr-Nd isotopes and highly-incompatible elements). 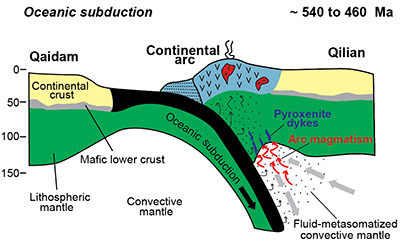
Figure 2. Cartoon representing our interpretation of the formation and evolution processes of the Shenglikou pyroxenite dykes within a tectonic framework of an early Paleozoic active continental margin, NE Tibet.
This study illustrates a detailed dynamic process of arc magmatism within the mantle wedge beneath an active continental margin (Fig. 2). A strongly metasomatised convective mantle moved as corner flow resulting from the early Cambrian subduction of the Proto-Tethys oceanic slab. The decompression and flux melting generated magmas that intruded into the overlying lithospheric mantle wedge as pyroxenite dykes. We suggest this is a significant process to allow the mafic-ultramafic complements of continental-arc lavas to escape delamination back to the convective mantle.
This project is part of CCFS Theme 2, Earth Evolution, and contributes to understanding Earth’s Architecture and Fluid Fluxes.
Contacts: Qing Xiong, Sue. O’Reilly, Bill Griffin, Norman Pearson, Jian-Ping Zheng (China University of Geosciences, Wuhan)
Funded by: ARC Discovery , Centre of Excellence Grants (S.Y.O’R and W.L.G.), NSFC (J.P.Z.), CSC scholarship, IMQRES, MQ PGRF, EPS postgraduate fund
How soft is the lower crust? More ingredients to test the “jelly sandwich” model
Today, ancient rifting environments are important zones for the production of oil and minerals. Observations of rifted basement rocks, under the sediments that accumulate in the rifts, show they have experienced both shearing and extensional strain, often at lower-crustal depths. This project aims to develop a quantitative tool to determine the relative viscosity or “resistance to flow” of different rock types at lower-crustal levels. For such a study, “boudins” (French: a specific type of sausage; elongate sausage-shaped pieces of one rock layer aligned like a chain of pearls) can be used. Boudins occur where a harder, more competent layer in a weaker matrix is deformed by pure and/or simple shear, and at microscopic to landscape scales; they develop a variety of symmetric and asymmetric shapes. The temperature and pressure in the lower continental crust mean the rocks can flow and deform in ways unseen at the Earth’s surface, and different rock types have different physical characteristics, melting temperatures, hardness, flow characteristics and viscosity. Our study adds more information about the rheological characteristics of the lower crust and will provide new data to assess details of the “jelly sandwich” model (e.g. Jackson GSA Today, 2002).
In this project, we combine detailed field work with numerical simulations. The Anita Shear Zone (ASZ) in Fiordland, New Zealand has been chosen as a field example; it is an excellent example of landscape scale, asymmetric ultramafic boudins formed at depth. The boudins are surrounded to the east by the Milford Orthogneiss and to the west by the Thurso Paragneiss. In the field, the first-order relative viscosities of the lithologies were determined, where the ultramafic layer is inferred to be the most viscous, followed by orthogneiss and then paragneiss. Field work uncovered a ~160m “soft”, high-strain zone between the orthogneiss and the ultramafics and a much wider high-strain zone between the paragneiss and the ultramafics.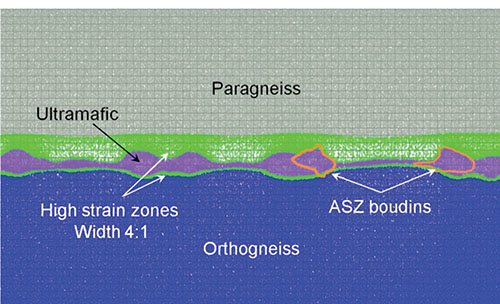
Simulated boudin formation where paragneiss:ultramafic:orthogneiss viscosity ratio is 1:5:3 with high strain zones with viscosity of 0.5 and paragneiss to orthogneiss zone width ratio of 4:1. The ASZ ultramafic boudins digitised from Google earth have been overlaid onto the simulated ultramafic boudins for comparison showing good agreement with the simulated shapes.
To investigate the impact of viscosity on boudin formation we used the Underworld software (Moresi et al., J. Comp. Phys, 2003) with, initially, three layers undergoing Newtonian flow with pure (extensional) shear, keeping the ultramafic:orthogneiss viscosity ratio at 5:3 and varying the paragneiss viscosity. Boudins started to form where the ultramafic:paragneiss viscosity ratio was 5:1, with better boudins forming as the ratio increased (5:0.5, 5:0.25 etc.). Subsequently, high-strain zones with a viscosity of 0.5 were added on either side of the more viscous ultramafic layer and the width of the high-strain zone on the orthogneiss side was varied. Boudin shapes similar to those of the ASZ were developed when the width of the paragneiss:orthogneiss high-strain zone was 4:1.
In general, the simulations show that individual boudins are more asymmetric where the paragneiss:orthogneiss high strain zone ratio is wider (4:1 cf 2:1) and the viscosity is asymmetric either side of the more viscous, boudinaging layer. A wider symmetric high-strain zone formed fewer, longer, more symmetrical boudins. This study highlights the importance of both high-strain zones and the relative viscosity of the lithologies for asymmetric boudin formation. Comparison of the symmetry and length of boudins measured in the field and those developed in numerical models allows quantitative determination of the relative viscosity ratio of the matrix and boudinaging layers.
This project is part of CCFS Theme 3, Earth Today, and contributes to understanding Earth’s Architecture and Fluid Fluxes.
Contacts: Robyn Gardner, Sandra Piazolo
Funded by: ARC Future Fellowship, MQ infrastructure funding, MQRES
Is the Moho the Crust-Mantle Boundary? Evolution of an idea
The concept that the Mohorovicic Discontinuity (Moho) detected seismically does not necessarily coincide with the base of the continental crust as defined by rock-type compositions was introduced in the early 1980s (see Griffin and O’Reilly, Geology 1987 and references therein). This had an important impact on understanding the nature of the crust-mantle boundary by integrating information from geophysics and the petrology and geochemistry of deep-seated samples brought to the surface either as fragments in magmas (xenoliths) or by tectonic activity. 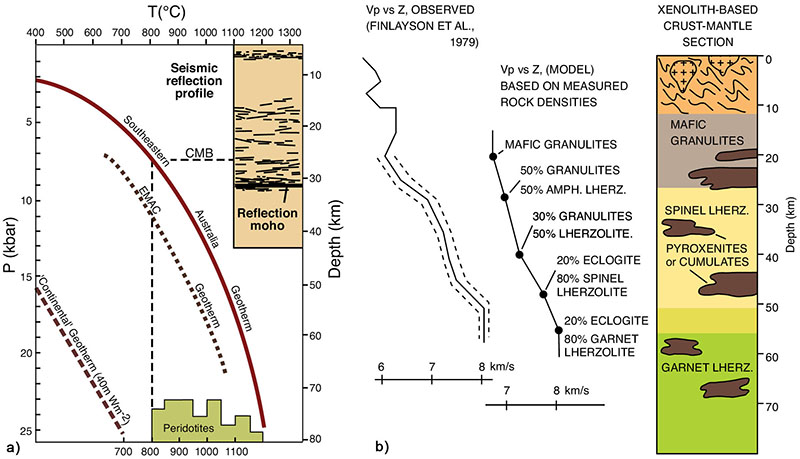
Figure 1. The geotherm generated by data from garnet+two-pyroxene xenoliths in alkali basalts of Eastern Australia. (a) Distribution of mantle peridotites beneath western Victoria, compared with the seismic reflection profile across the area (O’Reilly and Griffin, Geology, 1994); the crust-mantle boundary, as defined by the lowest temperature/depth estimates of abundant peridotite xenoliths, lies in the middle of the package of reflectors above the “reflection Moho” “EMAC” is the Eastern Margin of the Australian Craton. (b) Crust-mantle stratigraphy reconstructed from xenoliths and thermobarometry calculations beneath the Bullenmerri locality, compared with the seismic-velocity profile of Finlayson et al. (BMR Jnl. 1979).
The use of empirically-determined xenolith geotherms to plot the locus of the pressure-temperature curve with depth for specific lithospheric sections demonstrated that there is a variety of geotherms depending on tectonic environment. These geotherms range from very high near rift zones, through highly inflected but lower geotherms in active tectonic regions with basaltic volcanism (higher than “oceanic” geotherms), to very low geotherms in the most ancient cores of coherent cratons. These xenolith geotherms provided a robust framework for the construction of lithological sections through the lower crust and lithospheric mantle and revealed that the crust-mantle boundary is commonly transitional, over a depth range of 5 - 20 km or more, in off-craton regions. Early seismic-reflection data revealed that layering is common near the Moho and this correlates well with the petrological observation of multiple episodes of basaltic intrusion around the crust–mantle boundary. Petrologically, the crust-mantle boundary is defined as the depth at which peridotitic (mantle) wall rocks become dominant over mafic granulites and other deep-seated crustal rock types, and this boundary commonly lies 5 - 15 km above the seismically defined Moho, especially in off-craton regions.
Recent developments in seismological techniques, petrophysical laboratory measurements on natural rocks, and experimental petrology have refined interpretation of the formation of lower crust and uppermost mantle domains. The expansion of in situ geochronology (especially U-Pb ages and Hf-isotope composition of zircon and Os-isotope compositions of mantle sulfides) has allowed the recognition of linked tectonic events that have affected whole crust-mantle sections. These types of data reveal that the crust-mantle boundary has commonly changed in depth and thickness through time (CCFS Publication #235).
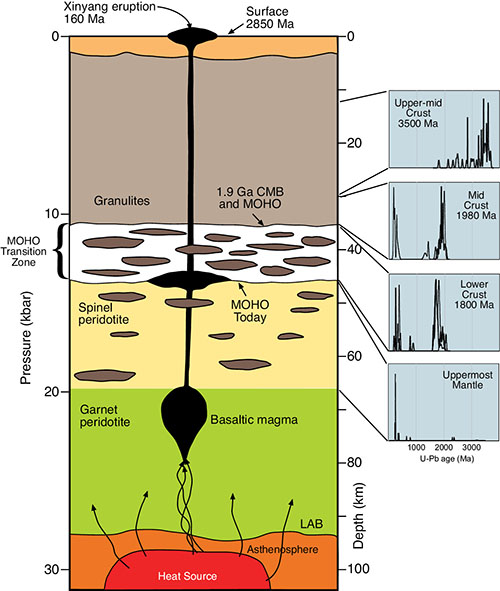
Figure 2. Crust-mantle section beneath the Xinyang area, on the southern edge of the North China Craton (after CCFS Publication #163). Histograms show U-Pb ages of zircons extracted from granulite, pyroxenite and peridotite xenoliths. The original 3.5 Ga crust was overplated at ca 2.85 Ga, and then underplated by mafic magmas at 1.9-2.0 Ga, and again at ca 1.6-1.8 Ga, lowering the crust-mantle boundary by ca 15 km. This lower crust and the subjacent upper mantle have been repeatedly intruded by mafic magmas from Paleozoic to Cenozoic time.
The main process effecting Moho depth variation is over- and under-plating of basaltic magmas at this major rheological boundary between peridotite and lower crustal rock types. This process is responsible for major crustal growth, resulting in a juvenile lower crust of mafic composition (which can then undergo melting and reworking to produce granitic magmas). In the alkali-basalt province of SE Australia the accumulated addition is approximately 5 km thick and occurred at a rate of about 900 m/Ma. This magma input is responsible for producing the characteristically high and inflected geotherm associated with such basaltic provinces before thermal decay occurs over about 30 million years.
However, the nature of the crust-mantle boundary in cratonic regions still remains enigmatic, mainly due to lack of key xenolith samples or exposed sections.
The observation that the Moho defined by seismic data may lie significantly deeper than the crust-mantle boundary has important implications for modelling the volume of the crust, especially in off-craton regions. Mapping of this crust using seismic techniques alone, without consideration of the petrological problems, may lead to an overestimation of crustal thickness by 15 – 30% and up to 50% in some areas. This will propagate to large uncertainties in the calculation of elemental mass balances relevant to crust-formation processes and the composition of the convecting mantle. For more details, refer to CCFS Publication #235.