Research Highlights 2014
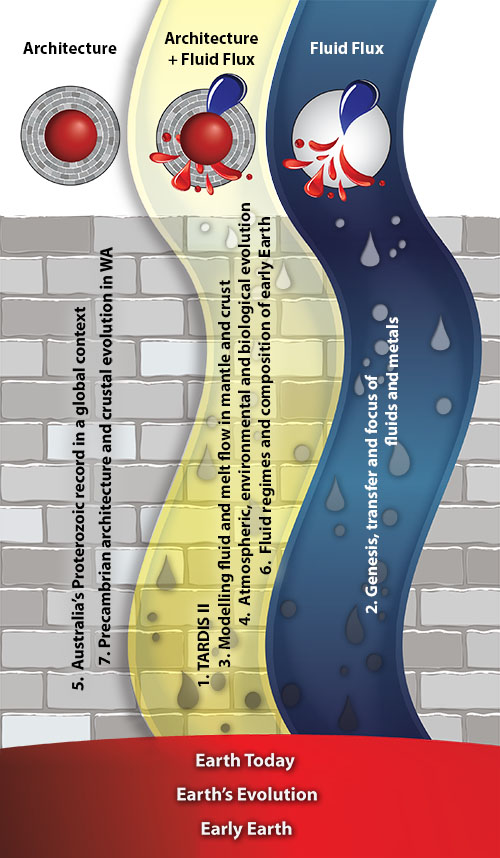
Following the new conceptual framework outlined here, these Research Highlights are identified as contributing to understanding Earth Architecture (the roadmap for fluids) and/or Fluid Fluxes (the “traffic report”), with logos for easy attribution. For a full description of the Foundation Programs, see Appendix 1. and for the Flagship Programs see Appendix 2.
Mineral exploration - Out of this world
Evaluating whether magmatic sulfide mineralisation exists on Mars can enhance our fundamental understanding of the processes that govern the evolution of such mineral systems on Earth - thus improving the scientific foundation upon which mineral exploration models are built. Understanding how and where potential ore-forming processes occurred on Mars is relevant both to long-term planning for future missions to the planet, and to designing exploration criteria for certain sample-return programs.
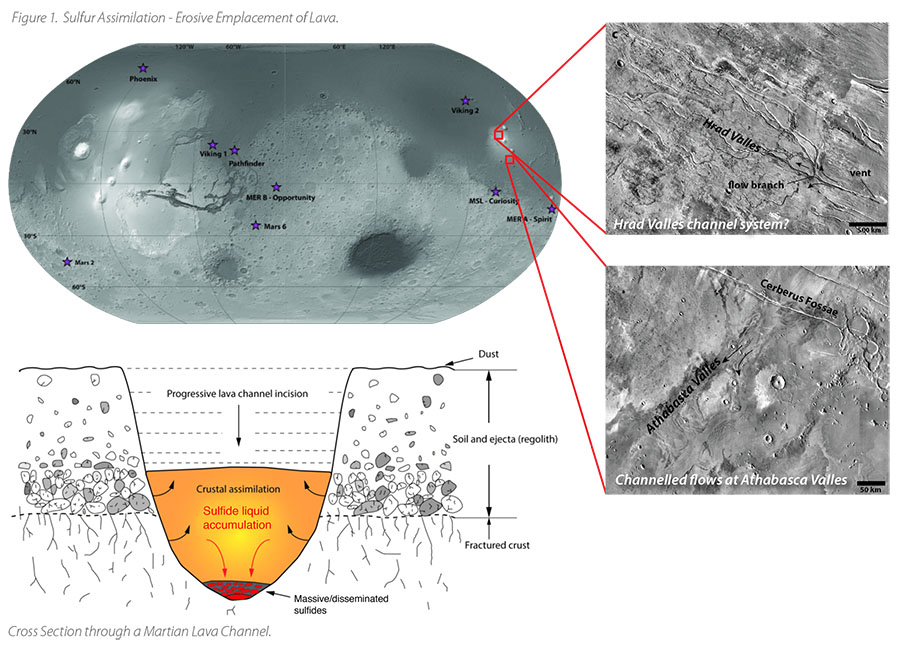
Widespread volcanic activity, showing striking mineralogical, petrographical and chemical similarities to terrestrial komatiites and
We found that potentially metal-rich Martian mantle melts probably reach sulfide saturation within 30 wt% crystal fractionation. This value is comparable to that calculated for the mineralised

This project is part of CCFS Theme 1, Early
Contact: Marco Fiorentini
Funded by: CCFS Flagship Program: Atmospheric, environmental and biological evolution
Scoping heat and composition in the depths below Central-Western US
Despite many geological and geophysical studies, the tectonic evolution of the Central-Western US region remains contentious. One of the major questions is the cause and timing of the uplift of the Colorado Plateau. Does the Plateau reflect mainly deep processes (e.g. large-scale dynamic topography) or shallow convection and heating? At least part of the controversy stems from the fact that studies of very different types (i.e. inversion
of seismic data, numerical simulations, geochemical studies, electromagnetic studies), with different resolutions and sensitivities to the thermochemical structure of the Earth’s interior have been used in isolation to explain the same observations. There is no a priori reason, however, why the results from these diverse studies should be strictly comparable, consistent or compatible, despite the fact that they all sample the same structure. Vastly different mechanisms can explain some observations (e.g. plateau elevation) equally well, and this does not inspire confidence in our understanding of important features of the Earth’s interior. This raises the question as to what extent different models are actually supported or required by independent geophysical, geological, and geochemical evidence.
Here we apply an innovative 3D multi-observable probabilistic inversion method (“thermochemical tomography”) using high-quality geophysical, geochemical and geological datasets to image the thermochemical structure of the Central-Western US. Working within this internally and thermodynamically consistent framework allows us to move beyond traditional methods and jointly use P-wave and S-wave teleseismic arrival times, Rayleigh wave phase dispersion data, Bouguer anomalies, long-wavelength gravity gradients, geoid height, absolute (local and dynamic) elevation, and data on surface heat flow. In our methodology, all physical and chemical parameters controlling model predictions are linked together by fundamental thermodynamic relations; the only independent variables in the inversion are therefore temperature, pressure and major-element composition. Accordingly, traditional tomographic images and models (e.g. S-wave velocity) are a by-product of our inversion rather than the main result.
We emphasise here that the thermal (and compositional) structure outcome is driven entirely by the constraining datasets. Thus, although we solve the 3D Stokes equations to obtain the instantaneous mantle flow and dynamic pressures arising from specific thermochemical structures required by data fits, small-scale convection patterns emerge only from the inversion of data, and are not imposed by flow computations. That makes it remarkable that cells of small-scale upwelling and downwelling (particularly beneath the Colorado Plateau region) with wavelengths of 200-300 km are recovered in the inversion (Fig. 1). These are the natural wavelengths of convection cells in the upper mantle. Our results demonstrate that the edges of the Colorado Plateau are being eroded by delamination and/or edge-driven downwellings. These downwellings transfer material from the lower parts of the lithospheric mantle to the upper sublithospheric mantle, changing its mean temperature and composition. This explains why the highly depleted nature of the uppermost lithospheric mantle becomes more obvious in regions where the Colorado Plateau lithosphere has been thinned or eroded by downwellings without associated volcanism.
Most of the present-day elevation in the Colorado Plateau area can be explained by a combination of lithosphere composition, crustal thickness and density structure, and thermal state, with only moderate localised contributions from sublithospheric upper-mantle convection. This analysis does not preclude the existence of deeper dynamic components, but it shows that large dynamic effects are not required to explain the available data. Our results therefore support models that require a net gain of lithospheric buoyancy since Laramide times.
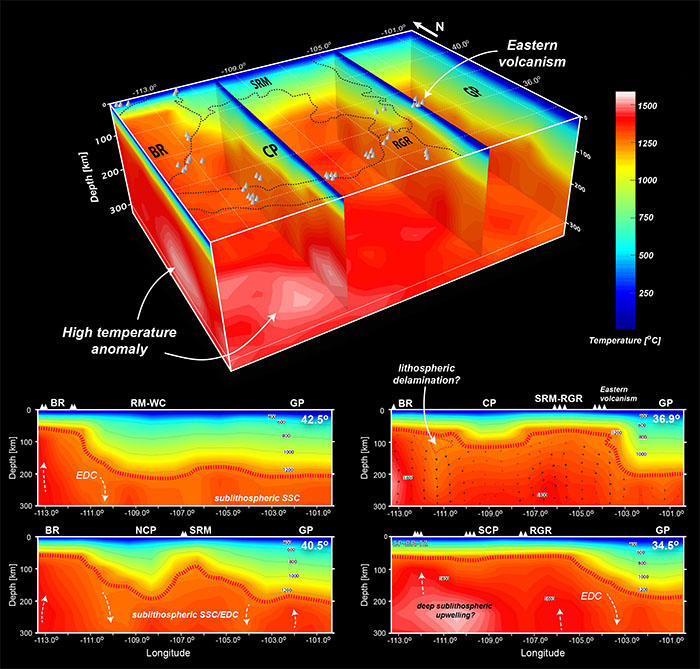
Figure 1. Top: Three-dimensional rendering of the thermal structure beneath Central-Western US. Major volcanic localities are indicated as white cones. Bottom: Temperature structure along four transects. The LAB is indicated by the thick red dashed line. Clear indications of both edge-driven convection (EDC) and sublithospheric small-scale convection (SSC) are visible in these transects. Cross-section at 36.9o includes the full instantaneous sublithospheric flow (as transparency); a clear downwelling is imaged beneath the western edge of the CP. SRM-WC = Southern Rocky Mountains-Wyoming Craton; NCP = Northern Colorado Plateau; SCP = Southern Colorado Plateau; BR = Basin and Range; RGR = Rio Grande Rift; GP = Great Plains.
The results reported here demonstrate that multi-observable thermochemical tomography described here, offers a robust method to characterise the fine-scale thermochemical structure of the lithosphere and upper mantle and opens new opportunities for deep-Earth imaging. The probabilistic nature and internally-consistent use of a number of key constraining datasets, all linked through a thermodynamic framework, gives the new method a unique sensitivity to thermal and chemical signatures that are otherwise difficult to assess unambiguously. This method allowed us to capture the complex interaction of structure and processes responsible for the present-day elevation of the Colorado Plateau, as well as directly imaging the dynamic behaviour of the upper mantle beneath the Central-Western US which, until now, has only been speculated upon, based on indirect proxies.
The intricate thermochemical structure of the lithospheric mantle seems to be linked more closely to interactions with the sublithospheric mantle via small-scale convection, melt production, and refertilisation of the lithospheric mantle rather than to physiographic or surface structures. Such interactions are likely to be key global and recurrent factors controlling the tectonic evolution of continental interiors and intra-plate epeirogenesis.

This project is part of CCFS Theme 3, Earth Today, and contributes to understanding Earth’s Architecture and Fluid Fluxes.
Contacts: Juan Carlos Afonso, Yingjie Yang
Funded by: ARC Discovery Project (DP120102372)
Giant porphyry copper deposits on the roof of the world
The Gangdese porphyry copper belt in southern Tibet, the roof of the world, is the most metal-rich porphyry copper system known from a continental collision zone. Numerous porphyry copper-molybdenum-gold (Cu-Mo-Au) deposits in this region contain over 20 million tons (Mt) of copper.
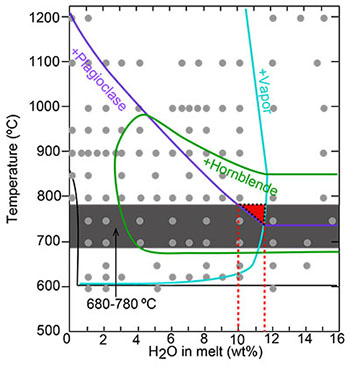
Figure 1. Temperature vs H2O plot. Each grey circle represents an experiment in which the stable mineral phases were identified in run products by Naney (1983; American Journal of Science, 283, 993-1033). Only the plagioclase (blue), hornblende (green) and vapour (turquoise) saturation curves are shown for clarity. The grey band is the range of zircon-saturation temperatures for Tibetan ore-forming high Sr/Y porphyries and the dashed red triangle is the field of the Tibetan ore-forming dacitic porphyries. The H2O contents in these ore-forming magmas are thus estimated to be at 10-12 wt% (red dashed lines).
These porphyry Cu deposits are genetically associated with dacitic-rhyolitic (SiO2>63 wt%) magmas with unusually high Sr/Y ratios (>40), which have been attributed to dehydration melting (no free water) of garnet amphibolites in a thickened lower crust beneath Tibet. To test this hypothesis and examine the hydration state of these magmas, we developed a geohygrometer for granitoid rocks, combining zircon-saturation thermometry and H2O-dependent phase equilibria (Fig. 1).
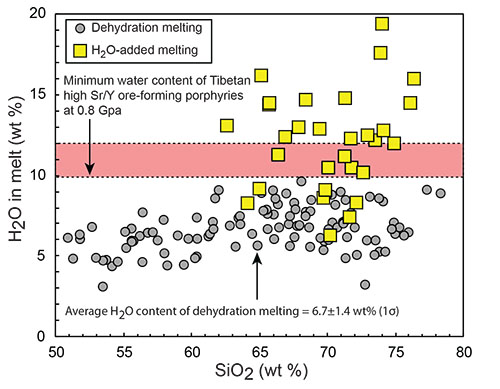
Figure 2. H2O vs SiO2 (wt %) in melts from H2O-absent and H2O-added experimental melting of basaltic amphibolite. The pink band highlights the minimum water content (10-12 wt %) of Tibetan copper-ore-forming porphyries.
The results show that the Tibetan high-Sr/Y ore-forming magmas had dissolved H2O contents >10 wt% (Fig. 1). This is far more water than can be supplied by dehydration melting of basaltic amphibolites (maximum of 6.7 ± 1.4 wt%; Fig. 2). Melting basaltic amphibolites in the presence of H2O can produce high Sr/Y hydrous dacitic-rhyolitic melts (Fig. 2), but only with lower Mg# (>50), MgO and Cr contents than the Tibetan ore-forming porphyries (Fig. 3). Mafic microgranular enclaves (MMEs) have been reported from several Miocene porphyry
Cu-Mo deposits in southern Tibet, which have much higher Mg#, MgO and Cr contents than partial melts of mafic lower crust (Fig. 3). These cognate enclaves, derived from metasomatised Tibetan mantle, represent quenched mafic magmas, injected into the porphyry-forming felsic magmas. They typically define fractionation trends and Sr-Nd-Hf isotopic compositions that relate them to the Tibetan ore-forming porphyries.
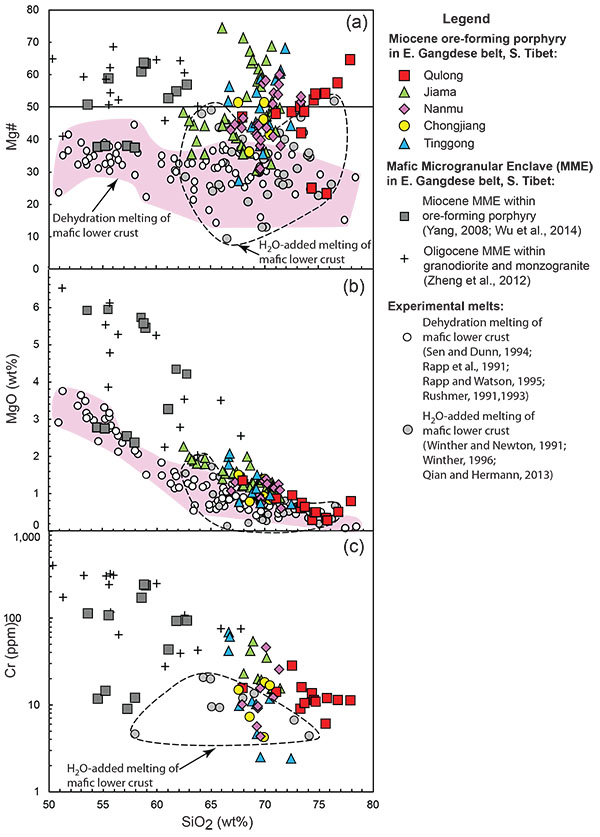
Figure 3. (a) Mg# vs SiO2, (b) MgO vs SiO2, and (c) Cr vs SiO2 plots for high Sr/Y Cu-ore-forming porphyries in southern Tibet.
These observations suggest an alternative model for the genesis of copper-rich high-Sr/Y magmas: they are residually H2O-enriched, high-pressure differentiation products of hydrous mafic partial melts of Tibetan mantle. The mid-Miocene stress regime was more compressive in the eastern portion of the Gangdese belt (where these porphyry copper deposits form) than in the western parts, where Miocene N-S trending rifts are abundant. The mafic magmas thus would tend to underplate the crust and differentiate and assimilate there until relatively silicic, hydrous residual melts have acquired sufficient buoyancy to overcome the compressive stress regime. During the high-pressure differentiation of mafic magmas, the resultant felsic magmas become rich in copper and water, so when they eventually reach the upper crust, they can form giant copper deposits.
Our new model implies that porphyry Cu deposits in continental collision zones have similar origins to those in other tectonic settings such as the circum-Pacific magmatic arcs. Therefore, a universal exploration model may be applied to search for porphyry deposits all over the world.
This project is part of CCFS themes 2 and 3, Earth Evolution and Earth Today, and contributes to understanding Earth’s architecture and fluid fluxes.
Contacts: Yongjun Lu, Marco L. Fiorentini
Funded by: ARC CCFS ECSTAR funds, CCFS pilot project.
A tale of two rheologies - deformation with and without fluid
Although the amount of free fluid in the Earth’s crust is very small, it plays a fundamental role in many geodynamic and geochemical processes. Field studies demonstrate that fluid circulation through the crust mainly occurs through localised sites of intense deformation, such as faults and shear zones. Although in recent years fluid-rock interaction during deformation has been much studied, it is still one of the least understood aspects in crustal tectonics.
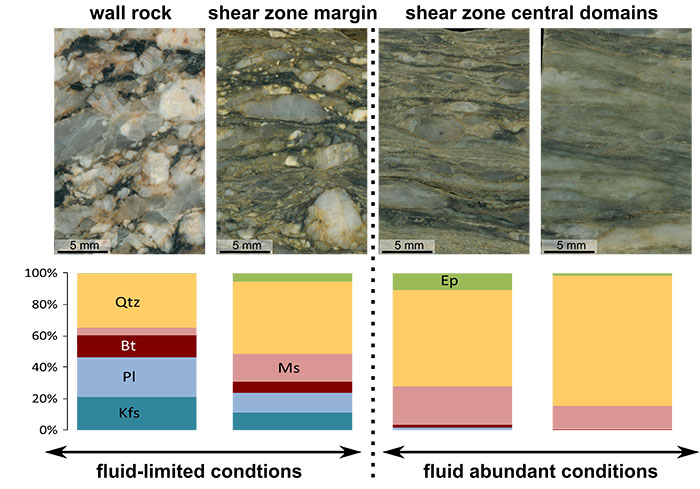
Figure 1. The structural and mineralogical evolution of fabrics across the shear zone.
The hydrated mid-crustal shear zones in the Wyangala Granite (SE Australia) displays a very localised infiltration of external syn-tectonic fluids, limited to the central domains, while the shear zone margins have remained relatively “dry” during the deformation allowing identification of the particular effects fluid exert on the rock rheology (flow behaviour during deformation).
Two cases can be distinguished: (1) the “fluid-deprived” shear zone margins preserve many similarities with the wall rock granite, chemically, mineralogically and structurally. The most deformed mineral in these domains is quartz displaying crystallographic preferred orientation and dynamic recrystallisation microstructures, which indicate the dominance of dislocation creep regime (described by a power-law function), which is consistent with the predictions of current theoretical models for the Earth’s crust. (2) In the highly hydrated central domains of the shear zone, the granitic host rock is transformed into a fine grained quartz-muscovite phyllonite. During deformation feldspar breaks down into fine-grained muscovite-quartz-epidote aggregates, deformation occurs by pressure-solution creep and grain boundary sliding in the feldspar reaction products, as well as basal slip of muscovite, while remaining quartz porphyroclasts experienced very little deformation.
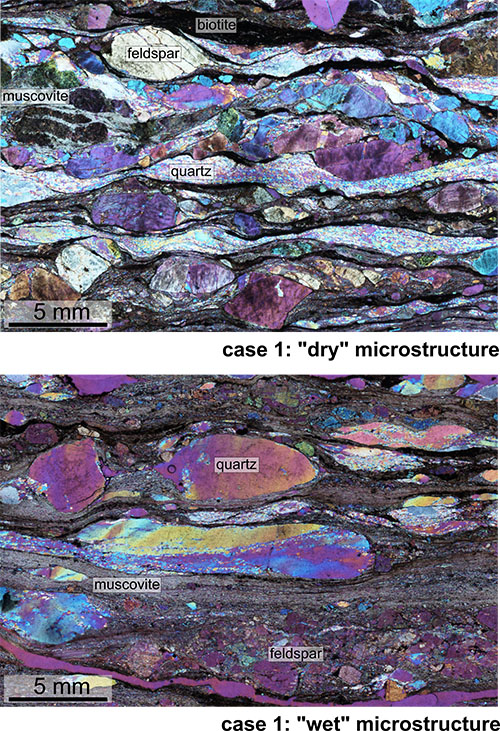
Figure 2. Optical photographs (through gypsum plate) of microstructures developed in a case of (1) “dry” deformation on the shear zone margins and (2) “wet” deformation in the shear zone centre.
All of these processes are facilitated by fluid and are characterised by a linear creep function resulting in extreme softening and strain localisation.
This study demonstrates the dramatic softening fluids induce on rock rheology, and points out the limited applicability of theoretical models based on dry rheologies for deformation in the Middle crust, where metasomatic fluids are common.
This project is part of CCFS Theme 2, Earth Evolution, and contributes to understanding Earth’s Architecture and Fluid Fluxes
Contacts: Liene Spruzeniece, Sandra Piazolo
Funded by: ARC Discovery Project (DP120102060)
Dating kimberlites and mantle evolution below southern Africa
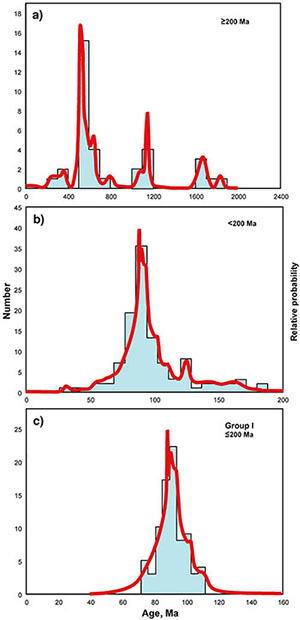
Figure 1. Cumulative-probability plots and histograms for U-Pb ages on perovskites. (a) ages >200 Ma; (b) ages <200 ma, showing buildup to main peak; (c) Group I kimberlites with ages <110 Ma (main pulse) showing abrupt cut-off at <80 Ma.
Kimberlite magmas represent our best source of information on the composition and evolution of the deep continental lithosphere, but extracting that information can be difficult, because kimberlites typically are jumbled mixtures of the original magma and debris carried up from the mantle. However, perovskite (CaTiO3, with extensive substitution by Sr, U and REE) occurs in many kimberlites as a groundmass phase, early-crystallising in most cases. Its chemistry allows not only U-Pb dating of the kimberlite’s emplacement, but Sr- and Nd isotopes carry information on the source(s) of the magma (CCFS Publication #466). We have dated groundmass perovskite by LA-ICPMS U-Pb techniques in 135 kimberlites and related rocks from 110 localities across southern Africa. Sr and/or Nd isotopes have been analysed by LA-MC-ICPMS in a subset of these; combined with published data this gives 89Sr-age datasets and 85Nd-age datasets. The age distribution (Fig. 1) shows peaks at 1600-1800 Ma, 1000-1200 Ma, 500-800 Ma and 50-130 Ma. The major “bloom” of Group I kimberlites at ~90 ±10 Ma was preceded by a slow buildup in magmatic activity that began at ~70 Ma. The main pulse of the cluster of kimberlites at 120-130 Ma (called “Group II”) was a distinct major episode within this buildup.
The Sr- and Nd-isotope data (Figs. 2 and 3) show that the subcontinental lithospheric mantle (SCLM) sampled by the younger kimberlites was isotopically heterogeneous, and that this heterogeneity reflects a metasomatic refertilisation that may have begun as early as 1.2 Ga ago, but probably was episodic. This metasomatically modified mantle was sampled extensively by the Group II kimberlites that erupted at 120-130 Ma. However, the latest major bloom of Group 1 kimberlites (~90 ±10 Ma) sampled a much more strongly metasomatised mantle.
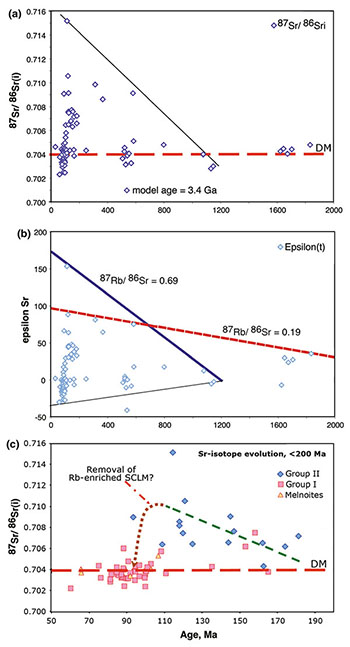
Figure 2. Sr-isotope data for perovskite in the analysed kimberlites, plotted vs time, to show the increased variability of the isotopic signatures of kimberlites toward the present. Heavy lines in (b) show the evolution of the radiogenic Reservoir 1 that could have contaminated the younger kimberlites, assuming that the necessary metasomatism occurred at ca 1.2 Ga or ca 2.0 Ga. Light line in (b) shows the depletion in Rb/Sr (relative to DM) that would be required to produce Reservoir 2 with low 87Sr/86Sr. (c) shows details of the data for the last 200 Ma, with an interpretation of the data in terms of the destruction of reservoir (1).
Figure 4 shows the spatial distribution of εNd and εSr overlain on the seismic-tomography image of southern Africa generated by the Kaapvaal Seismic Project (Fouch et al., 2004). The most striking observation from these maps is that the samples with the lowest εNd and the highest εSr are concentrated in three areas: around the low-Vs feature that marks the intrusion path of the Bushveld Complex, along the Kimberley belt, and in the off-craton “tail” of kimberlites. The geochemical signature implies long-term geochemical enrichment in the LREE relative to the HREE (and hence low Sm/Nd) and high Rb/Sr. There is an obvious correlation between this clearly metasomatic signature and low Vs, as would be predicted from studies of xenoliths, where this type of trace-element enrichment is associated with higher Fe/Mg, Ca and Al, and lower calculated seismic velocities (Griffin et al. 2009).
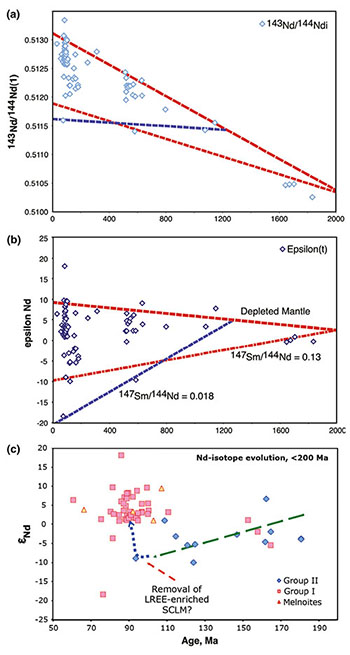
Figure 3. Nd-isotope data from perovskite in the analysed kimberlites, plotted against intrusion age. Dashed lines show the evolution of the depleted mantle, and of volumes metasomatised at ca 1.2 Ga or 2.0 Ga, labeled with the Sm/Nd ratio that would be needed for these volumes to evolve unradiogenic Nd-isotope compositions like those seen in some of the samples. (c) shows details of the data for the last 200 Ma, with an interpretation of the data in terms of the destruction of reservoir (1).
These maps suggest that volumes of metasomatised SCLM with very low εNd and high 87Sr/86Sr, (the characteristic isotopic signature of Group II kimberlites (~120-130 Ma)), were confined to low-Vs zones along trans-lithospheric structures. These include the locus of the Bushveld intrusion, major faults and craton boundaries. Such metasomatised zones existed as early as 1800 Ma, but were only sporadically tapped until the magmatic buildup began at ca 170 Ma, and apparently were mostly gone by ca 110 Ma. We suggest that these metasomatised volumes resided mainly in the deep SCLM, and that their low-melting-point components were “burned off” by rising temperatures, presumably due to an asthenospheric upwelling that led to SCLM thinning and a well-documented rise in the ambient geotherm between 120 Ma and 90 Ma. The younger Group I kimberlites therefore rarely interacted with such SCLM, but had improved access to shallower volumes of differently metasomatised, ancient SCLM with low 87Sr/86Sr and intermediate εNd (0-5). The kimberlite compositions therefore record the slow evolution of the SCLM of southern Africa, from 1.8 Ga through a refertilisation event around 1 Ga ago, and a major thermal and compositional change at ca 110 Ma.
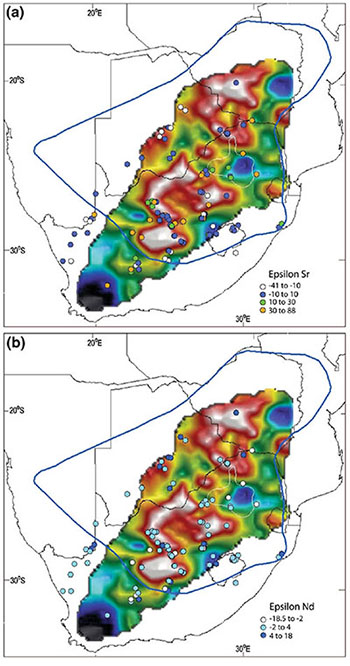
Figure 4. Values of εSr (upper) and εNd (lower) superimposed on the Vs tomography for the 150 km depth slice (after Begg et al., 2009), illustrating the association of metasomatic signatures (high εSr and low εNd) with low-Vs zones and trends. See Figure 2 for discussion of the velocity scales and interpretation of major tomographic features.
This project is part of CCFS Theme 2, Earth Evolution and contributes to understanding Earth’s Architecture and Fluid Fluxes.
Contact: Bill Griffin
Funded by: CCFS

The growth of the Tibetan Plateau: the last 25 Myr
The spectacular topography of the Tibetan Plateau (Fig. 1) is the result of collision between India and Eurasia over some 50 Myr, but how did the plateau grow to its present size? Previous work along the eastern Longmenshan margin (LM in Fig. 1) of the Tibetan Plateau suggests a two-stage uplift (thus growth of the plateau) since ~30 Myr: one from 30-25 Myr, and another from 15-10 Myr. Was this just a local feature, or does it reflect plateau-wide episodic lateral growth? We have used high-resolution seismic reflection and drill core data from the southern Tarim Basin to analyse the pattern of plateau growth along the West Kunlun margin (WK in Fig. 1) of the northwestern Tibetan Plateau. The work was carried out through collaboration with Professor Xiao-Dian Jiang of Ocean University of China and published in Nature Communications (CCFS contribution #496).
The continental lithosphere of the Tarim Block underthrusted northern Tibet to its south, with up to 12 km of Cenozoic foreland basin deposits accumulated along the southern Tarim due to the loading of the plateau. These deposits provide a unique record of the history of the mountain building. Seismic reflection and drill hole data were acquired in the foothills of the West Kunlun Range and the southwestern Tarim foreland basin by the Shengli Oilfield Company (location of seismic profile shown by red line in Fig. 1), and were made available for our research. The change in sedimentary environment from a marine carbonate platform in the Oligocene to a clastic tidal flat in the early Miocene marks the beginning of foreland-basin development due to the formation of the proto-West Kunlun Range at the northern edge of the proto-Tibetan Plateau. The temporal variation in the deposition/subsidence rate is taken as reflecting changes in the orogenic loading on the lithosphere of the Tarim Block, which would have resulted in isostasy-driven surface uplift at the present northwestern margin of the Tibetan Plateau. Rate estimates for the depocentre (green curve in Fig. 1) indicate that there have been two episodes of rapid uplift along the West Kunlun Range: one in the mid-Miocene (~16-11 Myr), and the in the last ca 5 Myr; the latter has been significantly faster. Using the differences in thickness between strata on the two sides of a frontal thrust, we calculated the relative uplift rate on the hanging wall as a function of time; this analysis also indicates two episodes of rapid uplift (purple curve in Fig. 1).
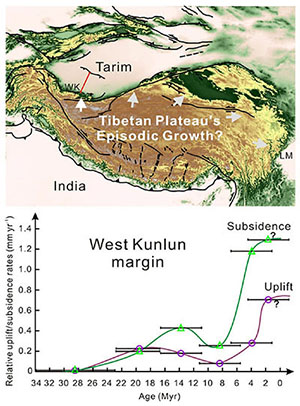
Figure 1. Location of the West Kunlun Range (WK) at the northwestern margin of the Tibetan Plateau, and time variations in estimated relative subsidence and uplift rates. The location of the seismic profile is shown as a red line. LM - the Longmenshan Range.
Our data thus suggest that the uplift of northern Tibet started from near sea level at ~23 Myr; the first episode ended by ~10 Myr, followed by rapid uplift along the present plateau margin over the last 5 Ma. The contrast in the intensity of the two episodes probably indicates that during the first episode, the front of the proto-West Kunlun orogen at the edge of the plateau was off from its present position, and it only propagated to its present position during the second episode. This two-episode uplift history is comparable to that reported along the eastern margin of the Tibetan Plateau, suggesting that the growth of the Tibetan Plateau after the Eocene likely has been episodic in nature, and near-synchronous along both eastern and northern margins.
Recent work on both margins also suggests that brittle thickening of the upper crust plays the dominant role in plateau propagation along those margins (see CCFS contribution #223). There is thus a case for synchronous episodic plateau expansion, dominantly through brittle thickening of the upper crust rather than mechanisms like crustal channel flow.

This project is part of CCFS Theme 2, Earth’s Evolution, and contributes to understanding Earth’s Architecture.
Contact: Zheng-Xiang Li
Funded by: NSFC (40772124 and 41176038), CGS (GZH200900504)
Modelling mantle melting: New horizons
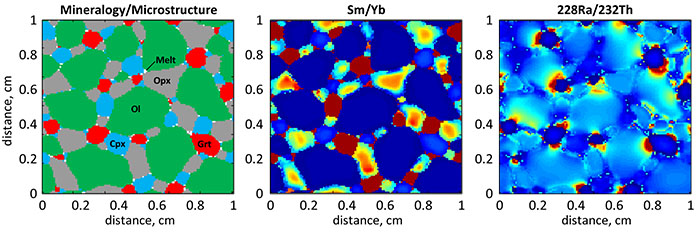 Figure 1.
One of the great goals of Geosciences is the explanation of geochemical data consistent with models of the Earth. Models are constrained by physical laws, so successful modelling explanations not only give multifaceted support to our stories about the formation and evolution of rocks, but simultaneously constrain the properties of the deep Earth from which they originate. Our project attempts to develop a new generation of detailed models for grain-scale microstructural evolution and chemical transport in the framework of classical irreversible thermodynamics. We have so far applied the current version of the models to the explanation of Rare-Earth Elements (REE) and Uranium-series isotopes in Ocean Island Basalts (OIB’s). Figure 1a illustrates an example of the microstructure showing the 2D distribution of 5 phases (olivine, opx, cpx, garnet, and melt) around the garnet transition, and Figures 1b and 1c show the corresponding distributions of Sm/Yb and 228Ra/232Th ratios throughout the microstructure. Because different trace elements are characterised by different partition and diffusion coefficients, very different diffusive features can be seen.
One success of our modelling efforts is the explanation of REE ratios in OIBs. As shown in Figure 2, if REE ratios are plotted against the age of the lithosphere on which OIB’s are erupted, we see step-like features in La/Sm and Sm/Yb ratios, separating low values over young (thin) lithosphere, and higher values on old (thick) lithosphere. The thin black line is a moving average of the data and the bold green line is our best model compared to the data. The fit is impressive, and by inspection of the properties of the model, we can infer the origin of the step-like feature. The step in La/Sm is caused by the onset of anhydrous melting, where melt productivity as a function of depth substantially increases.
Sm/Yb, on the other hand, reveals a garnet signature: when oceanic lithosphere is about 15 million years old, it is ~50 km thick, which happens to be the depth at which garnet is stable. As garnet preferentially holds heavy rare earth elements (e.g. Yb) during melting, Sm/Yb is high in magmas derived by melting beneath older lithosphere, and low otherwise.
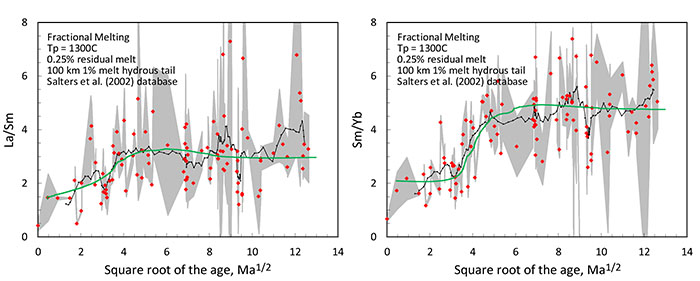
Figure 2.
An interesting consequence of these explanations is that the source of OIB must be at a temperature <1400°C, about the temperature of ambient mantle. If the source were warmer, the models cannot fit the data. In other words, thermal mantle plumes do not appear to be consistent with our analysis. On the other hand, classical thermal plumes may be a rare source of intra-oceanic volcanism.
This project is part of CCFS Theme 2, Earth Evolution, and contributes to understanding Earth’s Architecture and Fluid Fluxes.
Contacts: Christopher J. Grose, Juan Carlos Afonso
Funded by: ARC Discovery Project (DP120102372), ARC IPRS
Mesozoic flat-slab subduction and the opening of the South China Sea - clues from thermochronology
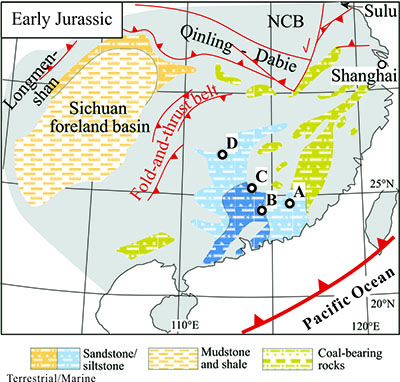
Figure 1. Paleogeographic map of the southeastern South China Block (SCB) showing areas studied in this project.
The South China Block (SCB) constitutes a major continental segment in the Western Pacific region (Fig. 1). Revealing the tectonothermal history of the region is fundamental to establishing the timing and kinematics of flat-slab subduction, foundering, and the opening of a marginal South China Sea.
We have carried out the first comprehensive thermochronological analysis of four areas in the southeastern SCB, making up a SE-NW traverse from the coast to the inland (A-D in Fig. 1). Late Triassic muscovite and biotite 40Ar/39Ar ages (220-200 Ma) in the northwest are clearly older than the Late Jurassic ages from the southeast (165-155 Ma; Fig. 2a). Among forty-one zircon (U-Th-[Sm])/He ages, four ages are pre-Middle Jurassic (253, 245, 220 and 176 Ma) and the remaining ages range from the Late Jurassic (152 Ma) to the Late Cretaceous (75 Ma). The four pre-Middle Jurassic ages are all from the northwest (area D) and the southeast is dominated by Cretaceous ages (Fig. 2b). Apatite fission track ages cluster at 70-30 Ma; two older ages (90 Ma) are from samples in the northwest (Fig. 2c). Like the apatite fission- track dates, apatite (U-Th-[Sm])/He ages form a tight Late Cretaceous-Eocene cluster at 70-30 Ma (Fig. 2d).
According to the time-temperature trajectories extracted from both forward and inverse modelling of thermochronological data, area D records rapid cooling related to orogenic uplift and related erosion during the Late Triassic. This orogenic uplift is interpreted as a result of the approaching flat subduction of a paleo-Pacific oceanic plateau from the southeast. At the same time, regions to the southeast were sagging and receiving terrestrial and shallow-marine sediments during the Late Triassic and Early Jurassic (Fig. 1 and 3). This may have resulted from the gravitational pull of the eclogitised oceanic flat slab (Li and Li, 2007, Fig. 3). Significant magmatic reheating occurred first in area B in the Middle Jurassic and generated a thermal peak of ~300 °C. Subsequently, in the Late Jurassic, a thermal peak of 250-300 °C was recorded in areas C and A, to the n
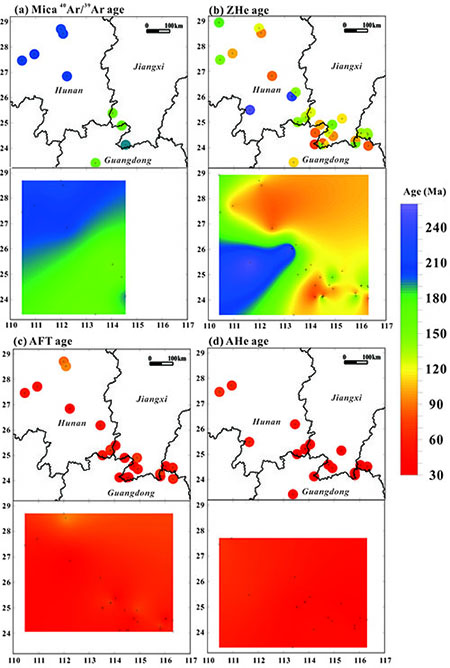
Figure 2. Database of new thermochronological ages in the southeastern SCB from this project. X-axis is longitude and y-axis is latitude. Mica 40Ar/39Ar = muscovite and biotite 40Ar/39Ar ages, ZHe = zircon (U-Th-[Sm])/He, AFT = apatite fission track ages, AHe = apatite (U-Th-[Sm])/He. Ages are expressed in Ma as circles; age values are indicated by the colour of circles. The pattern of ages was obtained by interpolation and smoothing of the data set. Previous data points are shown as black crosses in interpolated maps. Note that linking between areas without data points is by interpolation. The maps show the spatial distribution of ages and general trends; geology and faults are ignored.
Northwest and east of area B, respectively. This spatial distribution of Jurassic reheating is consistent with slab break-off as in a flat-slab model (Fig. 3).
The southern SCB was subjected to slow exhumation and cooling during the Cretaceous. The relatively quiescent, low temperature (200-100 °C) conditions reflect long-term thermal relaxation after the Middle-Late Jurassic magmatic heating. Such a protracted slow cooling is consistent with lithospheric rebound in the flat-slab model. Intensive Cretaceous magmatism in the coastal regions during the Cretaceous, interpreted as reflecting the roll-back of the remaining paleo-Pacific oceanic slab (Fig. 3; e.g. CCFS Publication #16), can account for the reheating recorded in area A.
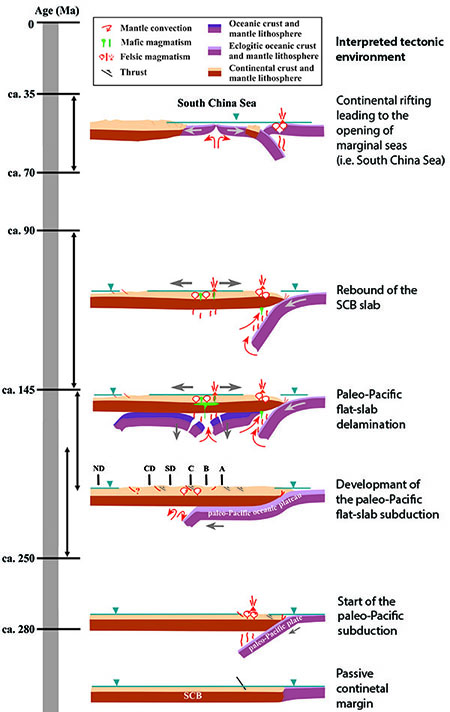
Figure 3. Schematic diagram showing the tectonic evolution of southeastern SCB, modified from Li and Li (2007); Li et al. (2012). Arrow bars on the left show the heat/cooling ages. ND = northern area D; CD = central area D; SD = southern area.
The Pacific subduction zone had migrated to the south of the present continental margin of SCB by ~90 Ma (Fig. 3; e.g. CCFS Publication #31). Rapid cooling from ~150 °C to surface temperatures started as early as latest Cretaceous time and lasted until the late Eocene, coinciding with rifting in the southeastern SCB that has been linked to the rollback of the subducting western Pacific oceanic plates. This rifting event ultimately led to the opening of the South China Sea (Fig. 3; e.g. CCFS Publication #31).
This project is part of CCFS Theme 2, Earth Evolution, and contributes to understanding Earth’s Architecture.
Contacts: Ni Tao, Zheng-Xiang Li
Funded by: CCFS, ARC Discovery Project (DP110104799)
Migrating ridges link the deep and shallow mantle
It has long been recognised that mid-ocean ridges (MORs) migrate in an absolute sense relative to the underlying mantle. Present-day MOR migration rates affect seafloor morphology and the physical state of the upper mantle, and these migration rates correlate with asymmetric seafloor spreading, lava generation at ridge crests, asymmetry in melting depths and geochemical discontinuities, and ridge morphology. However, the effects of long-term variations in MOR migration and the resulting non-uniform sampling of the upper mantle have not been studied, although there is growing evidence from MORB geochemistry and upper mantle seismic tomography, mantle convection simulations and laboratory models, to support close linkages between slowly migrating MORs and plumes in the present oceans.
Here, we use Large Igneous Provinces (LIPs) that have formed since the Early Cretaceous to demonstrate that ridge-plume interactions can continue for up to 180 Ma and strongly influence ridge migration rates. These long-standing MOR migration patterns and ridge-plume interactions influence the thermal structure of the upper mantle and the geochemistry of the ocean crust vs spreading segments (Fig. 1a) and their full spreading rates. To assess the relationships of slowly migrating ridges caused by plume-ridge interactions to the thermal structure of the upper mantle, we have developed and implemented a novel methodology to construct a global map of the relative volume of upper mantle material extracted through partial melting at MORs since the Early Cretaceous. Our map (Fig. 1b) is a proxy for the Volume of Extracted Mantle (VEM) and is calculated as a function of the residence time (i.e. the duration for which a MOR lies above an area of upper mantle) of the global MOR system and the rate at which material is extracted from the mantle (i.e. spreading rate).
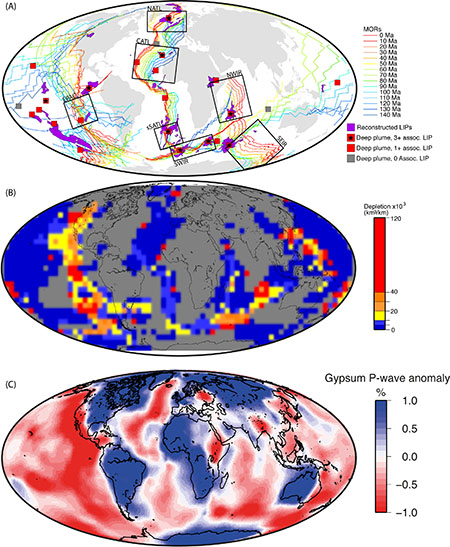
Figure 1. (A) Reconstructed mid-ocean ridges for the past 140 Myr in 10 Myr intervals. Black boxes show regions where ridge migration distances were computed along flow lines. CATL - Central Atlantic, EPAC - East Pacific Rise, NATL - North Atlantic, NWIR - Northwest Indian Ridge, SEIR - Southeast Indian Ridge, sSATL - southern South Atlantic, SWIR - Southwest Indian Ridge. LIP formation locations (purple) cluster around hotspots coinciding with slow ridge migration rates. (B) Estimated upper mantle VEM (km3/km of ridge). (C) 100-175 km S-wave velocities.
Regions with high VEM values indicate prolonged melt extraction and mantle focusing/processing by a relatively stationary MOR system with moderate to fast spreading rates, e.g. the Eastern Pacific. In contrast, rapid MOR migration, even with rapid spreading rates, does not result in high VEM values. We observe particularly slow MOR migration rates over the past 100 Ma at three ridges that currently exhibit ridge-plume interactions, namely the East Pacific Rise, the Southwest Indian Ridge, and the southern South Atlantic Ridge. On average, these three MOR systems have migrated <500 km in an absolute sense in the last 100 Ma, compared with absolute migration distances of >1500-2000 km for the Central and North Atlantic, and Northwest and Southeast Indian Ridges. We see evidence for higher upper mantle temperatures beneath slowly migrating ridges through global correlations between VEM and perturbations in both P- and S-wave velocity at depths 100-200 km. This is consistent with recent observations of higher upper mantle temperatures beneath spreading ridge segments located near deeply-sourced plumes. Together, patterns of MOR migration, LIP formation, and correlations of VEM with seismic tomography and MOR basalt geochemistry suggest a strong feedback between the dynamics of slowly migrating ridges and deeply-sourced plumes at global scale, which produce a self-sustained system over time scales up to 180 Ma.
In our proposed model, ridges at intermediate distances from plumes best represent the feedback mechanism. On the one hand, plume material will preferentially flow laterally towards areas with shallower lithosphere-asthenosphere interfaces (i.e. beneath MORs), with the effect of stabilising the MOR segment. On the other hand, the suction effect produced by the MOR will drain hot material from the plume and help stabilise the deeply-sourced plume.
These interactions result in a perturbation of the isotherm directly beneath the MOR, as hotter mantle is drawn towards the surface, a model supported by correlations between VEM, MOR basalt geochemistry and seismic tomography. Ridge segments located farther from the ridge-plume interaction are not affected by the ridge-plume interaction and are able to migrate more rapidly. These rapidly-migrating MORs do not perturb the upper mantle structure to any significant extent, nor focus large volumes of upper mantle towards the MOR. The plumes we have identified as participating in long-standing ridge-plume interactions are probably sourced from Large Low Shear Velocity Provinces. If these provinces are stable for very long periods of geological time, then it is possible that the relationships we observe between plume ridge interactions and slow MOR migration, and their effect on the thermal structure of the upper mantle are similarly stable. The stabilisation of MOR over time periods >180 million years, facilitated by ridge-plume interactions has significant implications for the way we model the plate-mantle system, and for understanding observed patterns of ridge morphology and geochemistry.
This project is part of CCFS Theme 3, Earth Today, and contributes to understanding Earth’s Architecture and Fluid Fluxes.
Contacts: J.C. Afonso, Jo Whittaker, Dietmar Muller
Funded by: CCFS Foundation Program 4, Two phase flow within the Earth’s mantle.
Deformation behaviour in polymineralic rocks
Deformation in rocks can be mainly localised in large ductile shear zones, broadly distributed into several smaller high-strain zones or dynamically change from one system to the other. One of the main reasons for strain localisation is a switch from Power-law flow, in which dislocation creep is a dominant deformation mechanism to Newtonian flow, in which deformation is dominated by diffusion or dislocation glide accommodated grain boundary sliding (GBS). A switch between these two types of flow will result in a marked weakening and strain localisation, because it lowers the effective viscosity of the rock by at least two orders of magnitude.
We have investigated the controls on the deformation behaviour of polymineralic rocks using a granitic pegmatite deformed at medium P and T conditions (CCFS Publication #501). The chosen sample is an example of a mesoscale system where several minerals with different rheological behaviour were deformed together and strain was localised in a complex system of high-strain zones at different scales.
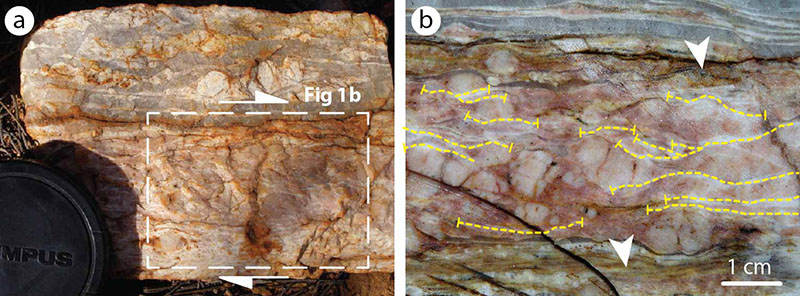
Figure 1. General characteristics of the studied sample: (a) hand specimen showing two main domains in pegmatite; (b) close-up of zone dominated by K-feldspar (pink) with several discontinuous microscale shear zones (yellow dashed lines) and two mesoscale zones of strain localisation below and above (white arrows).
The sample shows visible zonation in the distribution and grain size of the minerals (Fig.1a). In the initially coarse-grained, K-feldspar-dominated lower part of the sample, several microscale shear zones developed; two mesoscale shear zones separate this zone from the upper, quartz-rich part of the sample and the wall rock (Fig. 1b).
Microstructural observations, and chemical and EBSD data, show that mesoscale shear zones form at the boundary between zones with different mineral assemblages, especially between the initially K-feldspar-rich and quartz-rich zones. Microscale shear zones in the initially coarser-grained, feldspar-rich zone form by (i) intense recrystallisation in originally smaller grains of plagioclase, next to initially large K-feldspars deformed in the brittle regime; (ii) fracturing coupled with grain-size reduction through the interface-coupled dissolution and reprecipitation replacement of coarse-grained K-feldspar by fine-grained albitic plagioclase. Strain is localised in the newly formed, fine-grained plagioclase and causes advanced recrystallisation of adjacent K-feldspar.
Once the grain size is sufficiently small, grain-boundary sliding becomes the dominant deformation mechanism. Consequently, once micro- and mesoscale high-strain zones are interconnected, the rheology of the rock is controlled by Newtonian flow. Phase mixing and continuous high strain rates help to maintain small enough grain sizes to allow Newtonian flow over long periods, “stabilising” the high-strain zones.
Our study shows that, in polymineralic rocks, the variation in initial and developing grain size, as well as mineral distribution, governs the dynamic rheological behaviour of the rock as a whole.
This project is part of CCFS Theme 2, Earth Evolution, and contributes to understanding Fluid Fluxes.
Contacts: Daria Czaplinska, Sandra Piazolo
Funded by: ARC Discovery Project (DP120102060), Future Fellowship to Sandra Piazolo
Tibetan chromitites: Excavating the slab graveyard
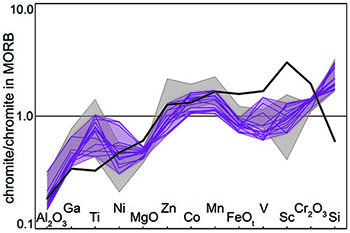
Figure 1. Major element oxide and minor/trace-element plot (normalised to MORB chromite (Page and Barnes 2009)) for chromites from Luobusa, Tibet (purple), the Antalya ophiolite complex, Turkey (grey), and chromite hosted in boninite-lavas from Bonin Island (black; Pagé and Barnes, 2009). Luobusa (Tibet) chromites have Cr# from 0.60-0.78 and Mg# 0.58-0.73; Antalya (Turkey) chromites have Cr# from 0.59-0.73 and Mg# from 0.55-0.69.
Large peridotite massifs are scattered along the 1500 km length of the Yarlung-Zangbo Suture Zone (southern Tibet, China), the major suture between Asian and Gondwana-derived terranes. Diamonds occur in the peridotites and chromitites of several massifs, together with an extensive suite of trace phases that indicate extremely low fO2 (SiC, nitrides, carbides, native elements) and/or ultra-high pressures (diamond, possible stishovite, coesite). Physical and isotopic (C, N) studies of the diamonds confirm they are natural, crystallised in a disequilibrium environment, and spent only a short time at mantle temperatures before exhumation and cooling (Howell, Griffin et al., submitted). These constraints are difficult to reconcile with previous models for the history of the diamond-bearing rocks. However, new investigations are providing evidence that these peridotite massifs have experienced a remarkable journey in time and space (CCFS Publication #522).
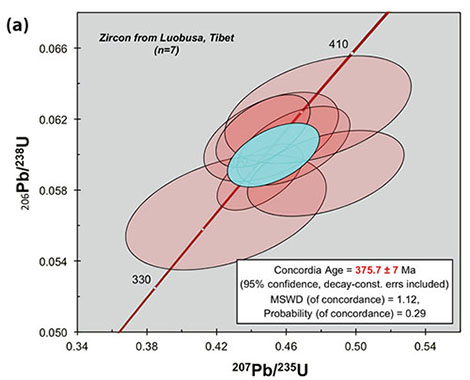
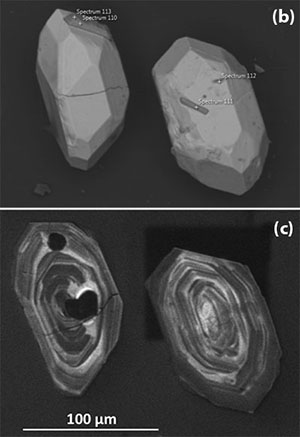
Figure 2. (a) Inverse 206Pb/238U vs 207Pb/235U concordia plot for zircon from Luobusa ophiolite, Tibet (n=7). Zircons from a Luobusa chromitite: (b) BSE image; (c) CL image. Dark inclusions are F-apatite; prisms of apatite are visible on both grains in (a).
We have uncovered evidence that strongly suggests some of these peridotites have undergone metamorphism in or near the upper part of the Transition Zone, around 400-600 km deep. This includes the discovery that many of the chromites contain exsolved pyroxenes and coesite, consistent with inversion from the high-pressure polymorph (calcium-ferrite structure) of chromite, which is stable in the Mantle Transition Zone. This high-P polymorph structure, unlike the normal spinel structure of chromite, can accommodate ions such as Ca2+ and Si4+; however, these elements are ejected (exsolved) when chromite is emplaced at shallow, (lower pressure) levels. This evidence, and the presence of diamonds, coesite and other high-pressure phases recorded in both the peridotites and the chromitites, suggest that the peridotite bodies have indeed risen from the Transition Zone. But how did they get there?
Figure 3. Model age ranges for b) Os-Ir alloys (Shi et al., 2007), and d) laurite. (a) and (c) show the data with the analysed analytical errors; in (b) and (d) the uncertainties have been expanded to a uniform 0.1 Ga.
An answer comes from CCFS’ extensive work on the trace-element geochemistry of chromites from many different geotectonic settings. The trace-element data for the Luobusa chromitites (Fig. 1) show that they are typical of chromitites formed above subduction zones by magma mixing, at shallow depths (tens of km) in the oceanic mantle. Euhedral, oscillatory-zoned zircons in the chromitites (Fig. 2), formed in this magma-mixing environment, give U-Pb ages of 376 ±7 Ma, εHf = 9.7±4.6, and δ18O = 4.8 to 8.2; the isotopic data are consistent with mingling of magmas derived from the oceanic mantle and a subducting slab. Os-Ir nuggets in the chromitites have Re-Os model ages (TRD) of 234±3 Ma, while TRD of in situ Ru-Os-Ir sulfides range from 290-630 Ma, peaking at ca 325 Ma. All of these ages are significantly older than the emplacement of the peridotites into the Yarlung-Zangbo suture zone (ca 130 Ma).
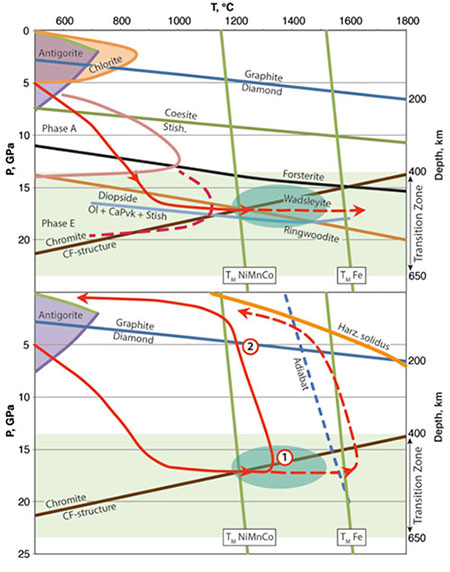
Figure 4. Reconstructed P-T-t path for the Luobusa-Kangjinla peridotite body. (a) stability fields of hydrous phases, and curves for relevant reactions and T constraints (see text); green oval outlines a probable P-T region for coexistence of wadsleyite, CF-structured chromite, and majoritic garnets. Red arrow illustrates subduction of mantle-wedge material into the Transition Zone, followed by heating to at least 1300 °C (constrained by the melting point of alloy inclusions in diamonds at TZ depths), or to >1500 °C (melting point of Fe). (b) Two end-member (low-T, high-T) adiabatic uplift paths are illustrated. Formation of diamonds is possible at point (1), but formation near point (2) would be more consistent with the lack of nitrogen aggregation in the diamonds.
A proposed P-T-t path (Fig. 3) traces the original formation of chromitites in mantle-wedge harzburgites, subduction of these harzburgites at ca 375 Ma, residence in the upper Transition Zone for >200 Ma, and rapid exhumation at ca 130 Ma. The Os-isotope data suggest that the subducted mantle consisted of previously depleted subcontinental lithosphere, dragged down by a subducting oceanic slab. Thermo-mechanical modeling (Fig. 4) shows that rollback of a younger subducting slab would produce a high-velocity channelised upwelling that could exhume the buoyant harzburgites (and their chromitites) from the Transition Zone in <10 Ma. This rapid upwelling could be the mechanism that brought some massifs to the surface in back-arc basins, forming parts of the oceanic crust basement. This model reconciles many apparently contradictory petrological and geological datasets. It also introduces a previously unrecognised, geodynamic process that may have operated in large collisional zones.
This project is part of CCFS Theme 2, Earth Evolution, and contributes to understanding Earth’s Architecture and Fluid Fluxes.
Contacts: Nicole McGowan, Bill Griffin
Funded by: CCFS Foundation Program; TARDIS: Tracking ancient residues distributed in the silicate Earth; APA, MQ PGRF
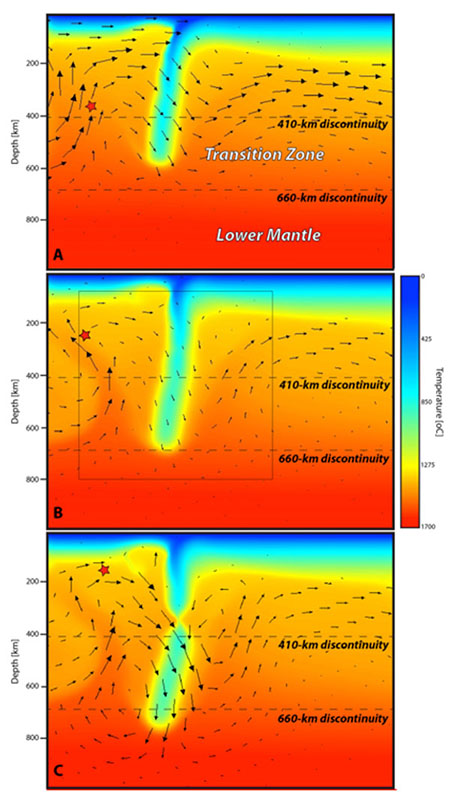
Figure 5. Ascent of TZ material in a thermo-mechanical simulation of continental collision involving slab roll-back and break-off. The simulation begins with a 400 km-long slab subducting at an angle of 45°. No boundary conditions are imposed on velocities, which are controlled entirely by the balance between internal forces (e.g. buoyancy, shear resistance, etc). More details can be found in Afonso & Zlotnik (2012). A) The verticalisation of the slab under the action of gravity generates a large-scale upwelling down to the TZ. B) This broad upwelling evolves into a narrower “channel” (favoured by a non-linear rheology) with velocities of 3-8 cm yr -1. C) Once the continental plate arrives at the trench, subduction slows down and a slab break-off occurs. At this point, material from the TZ has been brought up to lithospheric depths in <10Ma, to become part of smaller-scale lithospheric tectonic processes. Red star indicates the path of a low-density passive tracer, which is at a depth of 520 km at the beginning of the simulation.
New Ce-Nd separation techniques improve our ability to detect the early silicate differentiation of planetary bodies
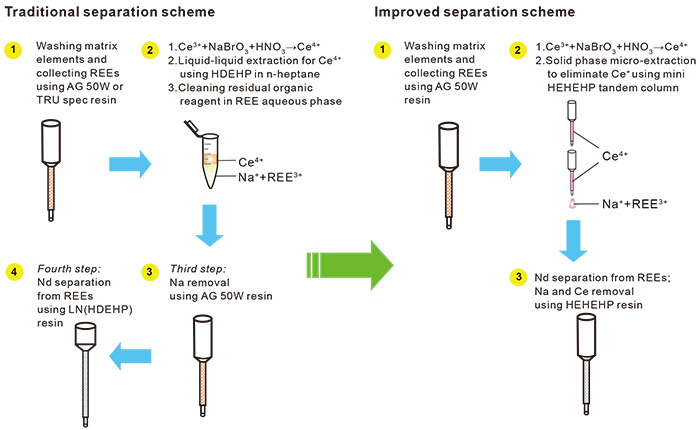
Figure 1. The new rapid solid-phase microextraction technique separation protocol compared with traditional methods.
Sm and Nd have two different radiogenic decay systems that can be useful for evaluating the hypothesis that the Earth and chondrites have the same Sm/Nd ratio: 146Sm decays to 142Nd (T1/2 = 68 Ma) and 147Sm decays to 143Nd (T1/2 = 106 Ga). The short-lived 146Sm-142Nd radioactive nuclides are ideal tools for constraining the early silicate differentiation of planetary bodies and the early history of the Earth’s mantle. Because of its low initial abundance, 146Sm is effectively extinct after 4-5 half-lives, so that 142Nd/144Nd anomalies can only be related to the differentiation of silicate reservoirs during the first few hundred million years of Earth’s history. However, 142Nd anomalies are expected to be extremely small (less than 40 ppm) and require ultra-precise measurements because the variation of 142Nd/144Nd is very small (<50 ppm). New-generation thermal-ionisation mass spectrometry (TIMS) has produced published reproducibilities of 142Nd/144Nd ca 5 to 7 ppm (2 RSD). For ultra-high-precision 142Nd/144Nd isotopic measurements the complete separation of Nd from the matrix and the isobaric interfering elements Ce and Sm is indispensible. During TIMS analysis, 140Ce/144Nd and 147Sm/144Nd must be lower than 0.000010.
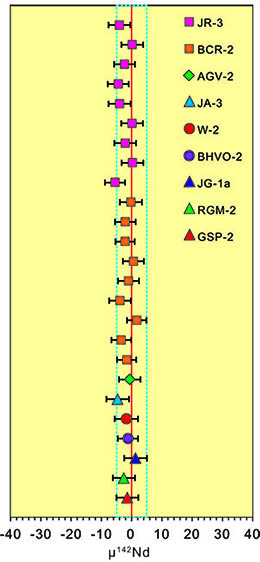
Figure 2. 142Nd/144Nd data for the CRM samples are plotted as deviations in ppm (μ 142Nd) from the JNdi-1 standard relative to the terrestrial Nd standard JNdi-1. μ142Nd = ((142Nd/144Nd)sample/(142Nd/144Nd)JNdi-1-1)×106, where the 142Nd/144Nd value of JNdi-1 is the average value in this study (1.1418367 ± 0.0000055, 2 SD, n = 37). The dashed lines delimit the external error of 5 ppm (2 RSD) of the repeated measurements of the JNdi-1 standard (n = 37). Error bars are 2 SE errors of individual measurements.
A rapid solid-phase microextraction technique, using HEHEHP resin, has been developed to completely separate Ce from rare earth element (REE) mixtures, including Nd (Fig. 1), and has been applied to ultra-high-precision measurement of 142Nd/144Nd in geological materials (Fig. 2). In contrast to the traditional liquid-liquid micro-extraction technique, the benefits of the SPME tandem column techniques are high Nd recovery, low residual Ce (Ce/Nd <10-6), and ease of operation. A single HEHEHP resin column, replacing the traditional two-column scheme (AG 50W + HDEHP resins), is used to further purify Nd by removing Na salt and Sm isobaric interferences. All mean values of 140Ce/144Nd of geological samples after separation are <0.000010, even though the Ce/Nd ratio of geological materials is >3.0. Thus, 142Ce interferences on 142Nd never exceed 1.3 ppm. Ultra-high-precision TIMS analyses of silicate standards show that the internal precision of all runs is better than 4 ppm (2 RSD) for 142Nd/144Nd values. Values of 142Nd/144Nd for JNdi-1, JR-3, and BCR-2 have external precisions of ±4.8, ±4.4, and ±3.9 ppm (2 RSD), respectively. The external reproducibility is sufficient to resolve 5 ppm anomalies in 142Nd/144Nd.
Compared to the traditional methods, the new separation procedure has advantages in terms of simplicity, Nd recovery, and miniaturisation.
This project is part of CCFS Theme 1, Early Earth
Contacts: Xuan-Ce Wang, Chao-Feng Li (IGGCAS, cfli@mail.iggcas.ac.cn)
Funded by: National Science Foundation of China (No. 41373020)
The thermochemical structure of the lithosphere and upper mantle beneath South China
South China is an ideal natural Earth laboratory for testing ideas about lithospheric structure and evolution. South China experienced major changes in the thermochemical structure of its lithospheric mantle throughout the Phanerozoic. Existing lithospheric models for this region are inconsistent with each other, but recently, abundant geophysical data (topography, geoid, surface heat flow and dense regional seismic arrays) and petrological/geochemical data on mantle-derived xenoliths have become available, and we have used these new data to test the competing lithospheric models.
By jointly inverting Rayleigh-wave dispersion data, geoid height, topography and surface heat flow with a probabilistic (Bayesian) Monte Carlo method, we have defined the thermal and compositional structure of South China. Our inversions show marked differences in the depth to the lithosphere-asthenosphere boundary between the eastern and western regions of South China. The lithosphere is thin (85-150 km) beneath the South China Fold system and thickens beneath the Yangtze Craton, reaching maximum thicknesses of up to 250 km beneath the Sichuan Basin. The average lithospheric composition predicted by our inversion is significantly fertile (Mg# ~88-90), in agreement with independent geochemical observations on mantle xenoliths in the volcanic rocks of East China. Such fertile compositions, together with the relatively thin lithosphere thickness, point towards a widespread metasomatism/refertilisation event.
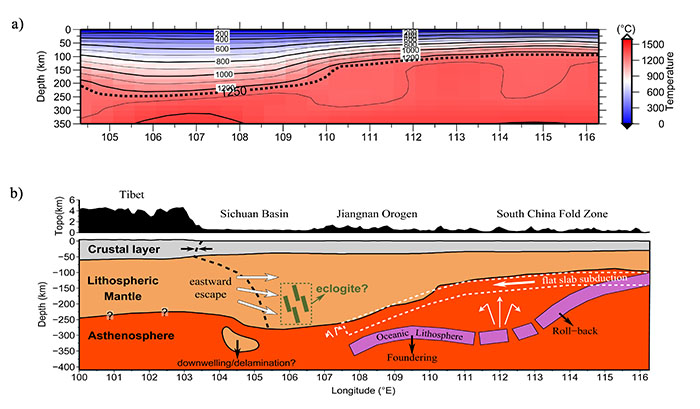
Figure 1. Temperature cross section obtained by interpolating the 1-D temperature structures; b) Cartoon illustrating a possible scenario for the thermochemical evolution of South China.
We suggest, as others have, that a flat-subduction episode and subsequent slab removal may have triggered both the delamination of the lowermost part of the subcontinental lithosphere and the generation of asthenospheric melts that metasomatised (refertilised) the remaining lithospheric mantle. Inconsistencies among geophysical observations and the anomalously fertile compositions derived from the Sichuan Basin indicate that this region may currently be affected by small-scale convection or delamination processes. Alternatively, the anomalous observations may be associated with the eastward push of Tibetan lithosphere beneath the Yangtze Craton.
This project is part of CCFS Theme 3, Earth Today, and contributes to understanding Earth’s Architecture.
Contacts: Bin Shan, Juan Carlos Afonso, Yingjie Yang
Funded by: ARC Discovery Project (DP120102372)
South China’s collision with northern India 580-470 million years ago to join Gondwanaland
The position of the South China Block (SCB) relevant to Gondwanaland during late Precambrian and early Palaeozoic remains a challenge to geoscientists. One peculiar observation has been that prior to the Ordovician-Silurian Wuyi-Yunkai intraplate orogeny, the Yangtze half of the SCB was dominated by platform carbonate deposits whereas the Cathaysia half received almost exclusively siliciclastic deposition. What caused such contrasting depositional environments over the same continent?
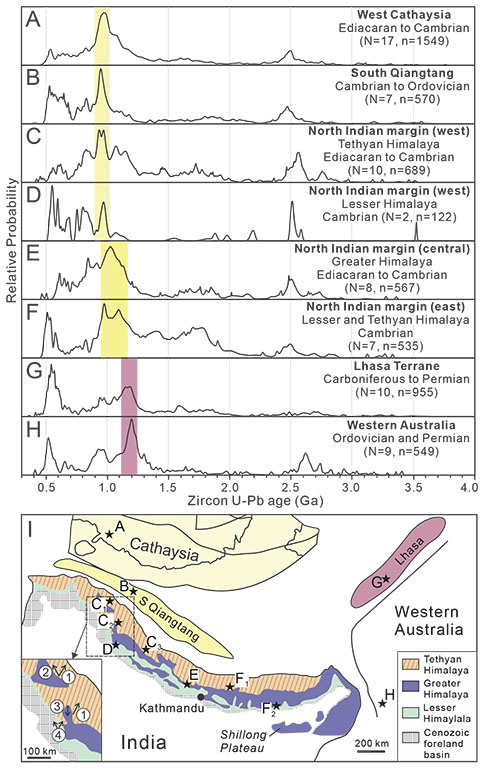
Figure 1. Provenance variations of Ediacaran-Cambrian sedimentary rocks along the northern margin of India and comparisons with southwestern South China and adjacent terranes. Age spectra in (A)-(H) correspond to data points A-H in the location cartoon (I), where data points C1-C3 and D represent the western North Indian margin, data points E represent the central North Indian margin, and data points F1 and F2 represent the eastern North Indian margin. Sources of detrital zircon age spectra can be found in Yao et al. (2014; Am. J. Sci.).
LA-ICP-MS U-Pb dating of detrital zircons from Cambrian sedimentary rocks in southwestern South China has revealed four major age populations with a predominant peak at 980 Ma (CCFS publication #366). Zircon Hf-O isotopes suggest three Precambrian episodes of juvenile crustal growth for the source areas, with major crustal reworking at 580 Ma. The source provenance as defined by the U-Pb and Hf-O analyses is distinctly different from the known tectonomagmatic record of the SCB, hinting at an external source. The sedimentary facies and modal composition of the Cambrian clastic rocks further show that the clastics were derived from a source southeast of the present-day South China mainland.
Possible candidates for this source, such as western Australia and western Laurentia fail to match the zircon U-Pb patterns of the South China rocks. In contrast, zircon U-Pb patterns and Hf isotopes of Ediacaran-Cambrian clastic sedimentary rocks and granites in northwestern Indian Himalaya match well with those of the South China clastic rocks (Fig. 1). In addition, the strongest provenance connection with the SCB, which started from 580 million years ago, appears to be with northwestern India, and weakens eastward along the Himalaya toward western Australia (Fig. 1). Terranes such as Qiangtang and Lhasa show provenance affinities with the Indian and Australian sections of the Gondwana margin, respectively.
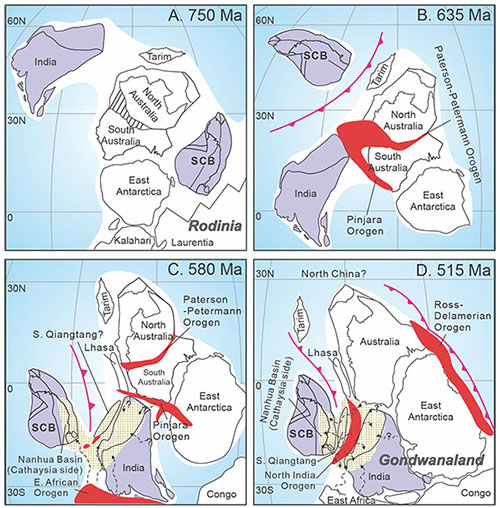
Figure 2. Paleogeographic reconstructions showing the position of South China (A) before the break-up of Rodinia in the mid-Neoproterozoic (750 Ma); (B) after Rodinia broke up, but prior to its collision with India during the assembly of Gondwanaland (635 Ma); (C) beginning of collision with NW India at ca 580 Ma during the assembly of Gondwanaland; (D) colliding with India to join Gondwanaland (515 Ma).
Together with a regional tectonostratigraphic analysis, our new results lead to a reconstruction of the tectonic evolution of the NE Gondwana margin for the late Neoproterozoic and earliest Paleozoic (Fig. 2). We propose that after breaking away from central Rodinia, South China started to approach northern India at about 580 million years ago during the assembly of Gondwanaland. Continental collision occurred between 580 and 440 million years ago, causing not only the so-called “Pan-African” orogeny at the northern margin of India but also the intraplate Wuyi-Yunkai orogeny in South China. The collision started with northwestern India, and finished with northestern India. The resulting orogens shed vast amounts of Ediacaran-Cambrian clastic sedimentary rocks to an evolving foreland basin (the Nanhua foreland basin) in the SE South China Block.
This project is part of CCFS Themes 2 and 3, Earth Evolution and Earth Today, and contributes to understanding Earth’s Architecture and Fluid Fluxes.
Contacts: Wei-Hua Yao, Zheng-Xiang Li
Funded by: CAS SAFEA(KZCX2-YW-Q04-06), NNSFC(41173039) and ARC Discovery Project (DP110104799). This project is part of CCFS Foundation Program 5: Earth rhythms
Volatiles and mantle melting: An experimental study
Mineral/melt partitioning of volatiles (in particular H2O) in the mantle is a first-order problem because of its influence on the distribution of melts and fluids in the mantle as well as the creation of the Earth’s hydrosphere. Melts and fluids also play a key role in both fractionating and transporting metals and incompatible elements between the mantle and crust/hydrosphere. Thus, experimental data on the partitioning of volatile and non-volatile elements between peridotite minerals and melts can be related to the broader issues of the Earth’s deep volatile cycle and its influence on mantle fractionation and evolution. The partitioning data generated within the framework of CCFS Foundation Program 2a define conditions under which relatively water-rich fluids and/or melts can exist in equilibrium with water-poor mantle host rocks. It also is relevant to the calculation of solidus temperatures for water-undersaturated mantle rocks.
Our new experimental data for the basanite UT-70489 include: H2O-saturated liquidus and subliquidus phase equilibria (Fig. 2); H2O-solubility data for 2.5 GPa, plus estimates of the 2.5 GPa liquidus of basanite under dry, and H2O-saturated (~28 wt % dissolved H2O) conditions (Fig. 3). These can be combined with published data for volatile-undersaturated basanite and for similar compositions (Fig. 3). The results fit to a polynomial that allows calculation of the effects of even small H2O concentrations on liquidus temperatures. Initially this effect is large but then tails off as concentrations increase. This integrated information can be used to calculate solidus temperatures for H2O-undersaturated mantle peridotites, which is probably the most common composition in the convecting asthenosphere.
Earlier studies have underplayed the role of low-degree melts in the asthenosphere. Earlier experiments on the liquidus of basanite showed that it is in equilibrium with garnet lherzolite at ~2.7 GPa and 1200 °C with 4.5 wt % of dissolved H2O and 2 wt% of dissolved CO2. These conditions are close to those estimated for oceanic geotherms. Using the D values for H2O from this study, it is also possible to calculate a concentration of ~230 ppm H2O for the residue. This is within the range of estimates for the MORB source. In this light, the presence of migratory solidus melts within the ordinary convecting asthenosphere seems both feasible and probable.
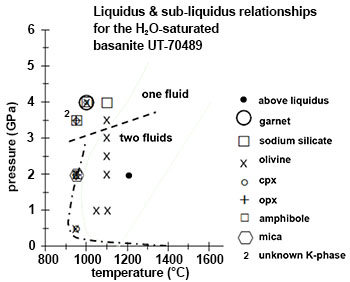
Figure 2. H2O-saturated liquidus and subliquidus phase equilibria for basanite bulk composition.
Currently, these results are being extended to 4.0 GPa by looking at liquidus equilibria for another potential primary melt composition (Laughing Jack Marsh melilitite). The initial results show that at 1400 °C, close to estimates of the mantle T at 4 GPa, this melilitite begins to melt with only 5 wt% of dissolved H2O (plus a small but unknown amount of CO2).
For H2O-saturated conditions, the basanite results require greater interpretation. Olivine is the liquidus phase up to at least 3.5 GPa and T close to 1100 °C. This is ~100 °C above the water-saturated peridotite solidus. In this case, the basanite is not an exact match to the H2O-saturated solidus melt. But from phase equilibria and mineral/melt partitioning, the H2O-saturated melt can be predicted to be less olivine-normative, but more SiO2- and Na2O-rich than the basanite at the same pressure (2.7 GPa). At pressures above those where complete miscibility occurs between basanitic melts and H2O (~3.5 GPa at 1100 °C), conditions can also be bracketed (3.5-4.0 GPa and 950-1000 °C) for the equilibration of a basanite-like melt/fluid (containing ~50 wt% H2O) with garnet lherzolite.
Because of the strong influence of pressure on solute concentrations in hydrous fluids, our results favour relatively high temperatures for the water-saturated peridotite solidus (1000 °C at 2.0-3.0 GPa) rather than the very low temperatures advocated by some workers (as low as 850 °C at 2.0 GPa).
This project is part of CCFS Themes 2 and 3, Earth Evolution and Earth Today, and contributes to understanding Fluid Fluxes.
Contacts: John Adam, Tracy Rushmer
Funded by: CCFS Foundation Project; 2a Metal sources
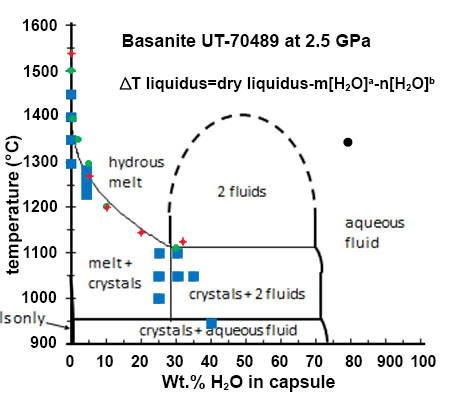
Figure 3. Water solubility at 2.5 GPa for basanite bulk composition in this study (blue squares) and the Mt. Leura basanite (red points) and Laughing Jack Marsh olivine melilitite (green points). See text for discussion.
Heterogeneous crust in the WA Craton
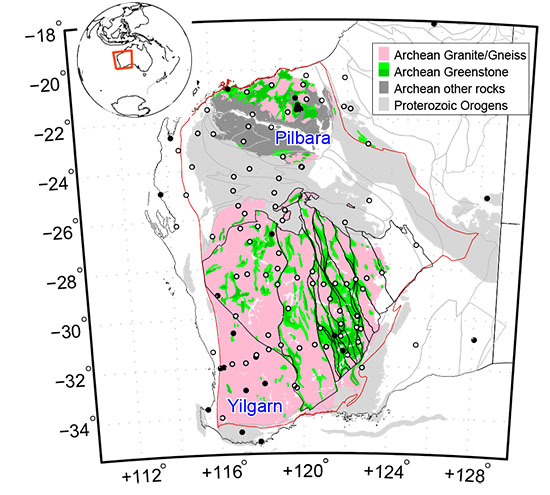
Figure 1. Seismic stations, rock ages and greenstone belts in the WA craton. Open and filled circles are temporary and permanent seismic stations. Red line contours the WA craton. Inset shows the location of the study region.
Recent seismic compilations show there is a global change in the characteristics of continental crust that was formed between 3.0Ga and 2.5Ga: older cratons have a thin, more felsic and less deformed crust with a very flat and sharp Moho; younger cratons have a thicker crust, more intermediate in composition and more deformed, usually with a diffuse Moho. These differences suggest a secular change in the processes of crustal growth in the late Archean.
Using the seismic receiver function technique, we have examined the crust in the Archean Western Australian (WA) Craton. We focused on its mean crustal properties and looked for possible links to its nearly 1 Ga history of early crustal formation. The crust in the constituent Pilbara and Yilgarn cratons is a typical mixture of plutonic rocks (granites) and supracrustal greenstone-facies rocks. The surface expression of these rocks are different across the two cratons: in the eastern and central Pilbara, granitoid domes and greenstone belts form a dome-and-keel pattern, while in the Yilgarn the granite-greenstone terranes are more elongated (Fig. 1), suggesting different tectonic processes during the growth and assembly of the two cratons.
Seismic records from available WA stations gave a fairly uniform coverage of the whole region. Receiver functions, the structural responses (functions) beneath a seismic station (receiver), were computed and stacked to derive the most coherent values for bulk crustal thickness (H) and the Vp/Vs ratio (k). The Vp/Vs ratio is closely related to crustal composition (Christensen, JGR 1996). It can be constrained robustly using the free-surface multiples of the Moho receiver function phase, which travel differently in P- and S-waves in the crust.
The crust in the WA craton is seismically heterogeneous (Fig. 2). While the Pilbara crust seems nearly uniform, the Yilgarn crust is spatially clustered into regions which correlate well with the surface tectonic units. The crustal density anomalies (Aitken et al., Tectonophys. 2013) and the mean crustal velocities (Salmon et al., GJI 2013) all indicate a similar pattern. The clustering in these observations indicates that the tectonic units in the WA craton are unique entities with deep-rooted geophysical signatures. Close inspection indicates that there is a weak correlation between the mean crustal thickness and the Vp/Vs ratio (Fig. 3), from the oldest crust in the Pilbara craton (formed ~3.6 Ga ago) to younger domains in the Yilgarn (<3.2 Ga). The Eastern Goldfields Superterrane, the youngest unit in the Yilgarn, is an outlier, which lies anomalously away from the trend.
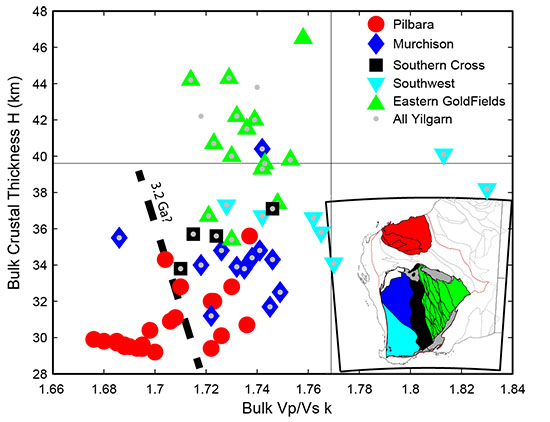
Figure 2. Bulk crustal properties in the WA craton. (a) Crustal thickness; (b) Vp/Vs ratio. Circles are stations.
Vertical tectonics has been proposed as responsible for the crustal structure of the Pilbara, especially in the >3.2 Ga mid- to eastern regions. The associated processes of plume impingement, melt differentiation, partial convective overturn, and delamination of lower crustal restites (van Kranendonk et al., Geological Society London Special Publication 2014), may have produced this extremely thin and felsic Pilbara crust.
Van Kranendonk et al. (2014) suspected that a transition towards accretional tectonics began about 3.2 Ga ago, as seen in linear trends of geological structures in the western Pilbara. In the Yilgarn. most crust is believed to have formed after 3.2 Ga (Griffin et al., Precambrian Research 2004). Most published crustal-genesis models favour arc accretion, as responsible for the elongated pattern defined by large-scale faults and greenstone belts. The processes associated with horizontal tectonics may have significantly contributed to the greater crustal thickness and more intermediate composition.
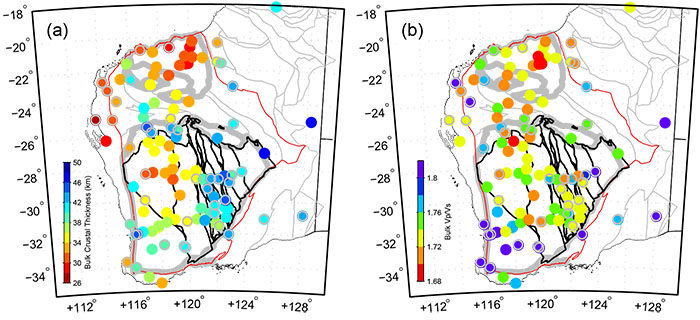
Figure 3. Clustering of bulk seismic properties in the WA crust. Thin lines show the global continental average. Thick dashed line shows a possible 3.2 Ga separation among all the measurements.
Much older crustal components (3.1-3.5 Ga; Griffin et al. 2004) have been recognised in the Murchison portion of the Yilgarn craton. These pieces of extraneous thin and felsic crust may have formed as in the Pilbara. Alternatively, late Archean plume activity in the region (Ivanic et al., AJES 2010) may have reworked the crust substantially. Younger plumes in the Eastern Goldfields Superterrane, as evidenced by the 2.7 Ga komatiites along the western margin, may have dominated the thick and intermediate crust concentrated in this region.
Seismic observations show a heterogeneous crust in the WA Craton. The spatial correlation with the Archean tectonic domains indicates the spatial heterogeneity may be deeply rooted, extending through the whole cratonic lithosphere. The temporal correlation suggests that the early crustal-formation processes may have worked differently through time, but have left distinct seismic signatures in the crust.
This project is part of CCFS Themes 1 and 2, Early Earth and Earth Evolution, and contributes to understanding Earth’s Architecture and Fluid Fluxes.
Contact: Huaiyu Yuan
Funded by: CCFS foundation Program 10a, 3D Architecture of the western Yilgarn Craton
The origin of the Moon: spin-up during core formation?
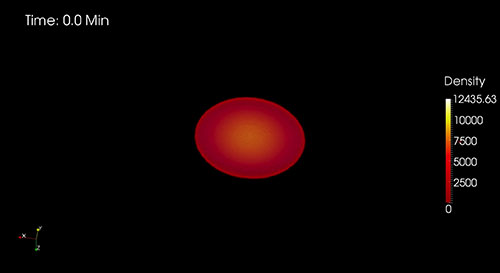
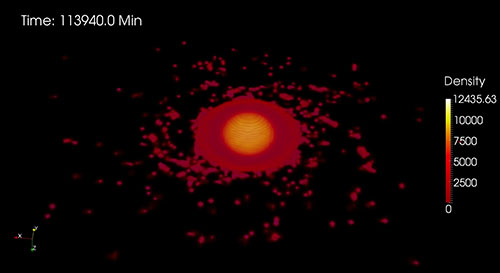
The Figure demonstrates the ejection of mass from the equatorial plane of a rapidly rotating proto-Earth, as a result of core formation. Using 50,000 interacting particles in a smoothed particle hydrodynamics simulation, we modelled the density re-distribution within a previously stable planet (top) during core formation, and track the increase in spin rate as a result of this, and the ejection of mass into a circum-planetary disk (bottom). The mass of this disk is sufficient to form Earth-sized Moons.
The origin of the Moon is an ancient problem. The leading theory in recent decades has been a giant impact hypothesis, where a Mars-sized impactor - dubbed Theia - hit the protoEarth in a glancing impact in the late stages of accretion, ejecting a circum-planetary disk from which the Moon formed. The canonical models, however, predict that up to 60% of the Moon forms from material from the impactor Theia. However, the Moon and Earth’s mantle have essentially identical oxygen and titanium isotopic signatures, distinct from any other planetary body, so a large contribution from Theia seems unlikely.
As a result, the impact community has moved towards special classes of impacts, with either a smaller impactor colliding with a rapidly-spinning proto-Earth, or two similarly-sized impactors in a head-on collision. Both require substantial loss of angular momentum in the Earth-Moon system and imply initial spin rates for the Earth of 1-4 hours, in line with recent accretion modelling.
We have developed an alternative scenario to explain the isotopic similarity of the Earth and Moon. Using parallel smoothed-particle hydrodynamic simulations, and a code developed within CCFS, we found that core formation in a rapidly rotating proto-Earth increases the angular momentum and results in a spin-up of the body. An analogy would be a twirling ice skater, increasing her rate of spin by pulling her arms in to her body. For fast initial rotations, this can result in mass being ejected along the equatorial plane. The magnitude of this effect depends on the initial spin, but for plausible rotation rates derived from accretion scenarios, the mass of disk ejected is between 0.2-3.5 lunar masses. The mass of the Moon predicted in the example shown is 0.6 Lunar masses, which compares well with the Moon. It also explains the Moon’s low iron content, as the event was preceded by a major stage of core formation, removing much iron from the mantle. While the angular momentum is larger than in the current Earth-Moon system, modelling has shown this momentum would rapidly be lost due to orbital resonance effects soon after Moon formation.
The timing is broadly consistent with the geochronology of the Moon and core formation - the oldest anorthosites on the Moon show that the Moon formed within the first 150 Myr of solar system history. Likewise Earth’s core formation is constrained to be within the first 45-140 Myr by U-Pb systematics, or 70-100 Myr from Rb-Sr data. This timescale also is consistent with large-scale atmospheric blow-off ~100 Myr after solar system formation, as recorded in Xe- isotope systematics. Recent analysis of the water content of the Moon suggest up to 1410 ppm of water in mantle olivines; this is difficult to reconcile with a giant impact, but would be a natural consequence of this mechanism.
Finally, Venus has a slow retrograde rotation, and accretion modelling suggests this is a consequence of the last few large impacts in its accretion history. Despite these orbit-altering impacts, Venus does not have a moon, and has retained its primordial contingent of radiogenic noble gases, suggesting that the large-scale atmospheric blow-off that affected Earth did not occur. Our mechanism suggests that Venus’ slow initial rotation made it difficult for core formation to spin the planet up enough to cause significant equatorial flattening. As a result, Venus never formed a Moon and did not experience the massive atmospheric loss expected during a mass spin-off event.
This project is part of CCFS Theme 1, Early Earth.
Contacts: Craig O’Neill, Siqi Zhang
Funded by: CCFS Foundation Program 4; Two phase flow within the Earth’s mantle
Fluid-present deformation aids chemical homogenisation in chromite
The deep Earth water cycle is strongly coupled to the dynamics of Earth’s interior. Oceanic crust descending into the deep mantle carries relatively little water, but even trace amounts of water affect physical and chemical properties, including melting temperature, rheology, deformation mechanism, electrical conductivity, etc. Ophiolitic chromitites are commonly regarded as resistant to fluid-related processes, and the chemical signatures of chromitites have been used to study processes in Earth’s mantle. However, modification during deformation may have important implications for the interpretation of chemical signatures in chromite. We have studied how deformation promotes chemical homogeneity in chromite hosted in the serpentinite body of Golyamo Kamenyane, in south Bulgaria (Gervilla et al., 2012; Colás et al., 2014). These chromitites have undergone deformation together with fluid-rock interaction during metamorphism, and previous work suggested that these chromitites are one of the most chemically modified and deformed examples known (Colás et al., 2014). We have documented how chromite has deformed and homogenised under fluid-present amphibolite-facies conditions, providing new insights on the microstructural evolution of chromite during retrograde metamorphism.
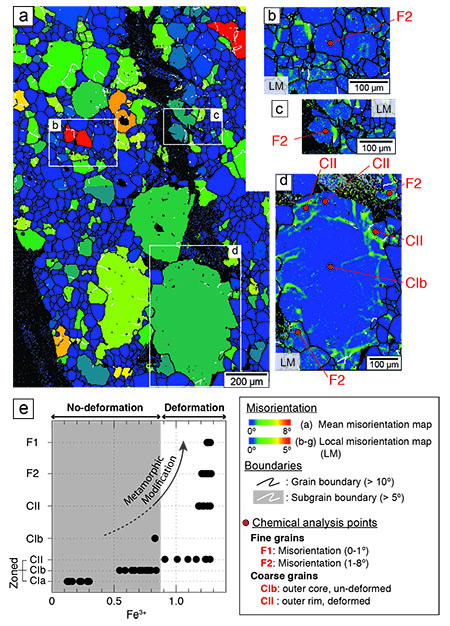
Figure 1. Orientation relationships as well as chemical composition of chromite porphyroclasts and adjacent fine grains. Step size of the map is 3 µm. (a) Colour coded EBSD map depicting the mean misorientation per grain (mean misorientation map). (b-d) EBSD maps showing local misorientations (LM) to identify crystal bending and subgrain boundaries below 5º. Fine grain types F1 and F2 are depicted. Chemical compositions at each red point are categorised according fine grain type (F1, F2) and coarse grain domain (CII, CIb). (e) Differences in chemical composition (Fe3+) of different coarse-grained chr omite domains (CIa, CIb and CII) and fine chromite grain types (F1 and F2), note that coarse grains have a general Fe3+-poor composition relative to the fine grains.
We measured crystallographic orientation relationships using Electron Back-Scattered Diffraction (EBSD) and electron microprobe analysis. Chromites show porphyroclastic textures with coarse-grained porphyroclasts (ca 0.2 ~5 mm) and fine-grained neoblasts (< 200 µm) (Fig. 1a). Large chromite grains are chemically zoned in terms of major elements from core to rim, preserving an initial igneous feature (CIa, CIb), while outer rims show a metamorphic signature (CII) (Fig. 1e). Large chromite grains also exhibit distinct intra-crystalline deformation including continuous crystal bending and subgrain boundaries, and chemical modification in their outer, deformed parts (CII; Fig. 1a, d). Two types of fine-grained chromite, F1 and F2, are recognised. F1 exhibits a well-developed polygonal texture, straight grain boundaries and low intercrystal misorientation (<1º); F2 shows low-angle boundaries and significant intercrystalline misorientation (2 ~8º) (Fig. 1a). Both F1 and F2 have higher Fe3+ and Cr and lower Mg# values than the cores of large grains (Fig. 1e). We interpret F1 and F2 to represent chromite recrystallised by heterogeneous nucleation and subgrain rotation recrystallisation, respectively.
Crystallographic preferred orientation (CPO) and misorientation data on the well-developed low-angle (subgrain) boundaries in coarse grains and F2 grains indicate that deformation in chromite was accommodated mainly by dislocation creep, dominantly activating the {111}<100> slip system. The retrograde P-T exhumation path defined by thermodynamic and chemical modelling suggests that these fine-grained chromites were produced when the initial chromitites reacted with oxidising fluids during retrograde metamorphism (~1.0 GPa and 500-700 ºC). Our results show that deformation in the dislocation-creep regime in a chemically-open system induced chemical modification and homogenisation within chromite aggregates as well as strain localisation. This close physicochemical link offers new avenues for the interpretation of chemical signatures in chromites, linked to their microstructurally-controlled variation.
This project is part of CCFS Theme 2 Earth Evolution, and contributes to understanding Earth’s Architecture and Fluid Fluxes.
Contacts: Takako Satsukawa, Bill Griffin, Sue O’Reilly, Sandra Piazolo
Funded by: CCFS Foundation Program 1, TARDIS-E
Mean plate velocity and the frequency of orogens: Secular changes in the supercontinent cycle?
We have used two sets of data for the last 2.5 Gyr to address the question of secular changes in the supercontinent cycle: the timing and locations of collisional and accretionary orogens, and average plate velocities as deduced from paleomagnetic and paleogeographic data. This analysis has been done in collaboration with Kent Condie (New Mexico Tech), Jun Korenaga (Yale University) and Steve Gardoll (Curtin University) (CCFS publication #468).
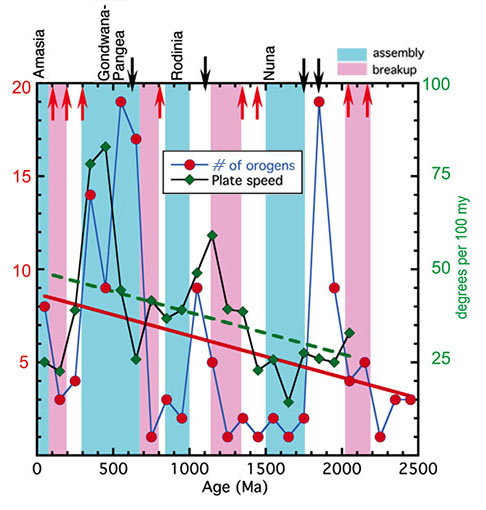
Figure 1. Secular changes in craton collision frequency and average area-weighted plate speed (deg/100 Myr). Collision frequency between cratons is expressed as number of orogen segments per 100-Myr bin moving in 100 Myr increments. Lines are linear regression analysis: n = 8.68-0.00224a, r = 0.287; s = 9.927-0.00223a, r = 0.393 (n, number of orogens; s, plate speed divided by five; a, age). Also shown are supercontinent assembly (blue stripes) and breakup (pink stripes) times. Major LIP (large igneous provinces) events: red arrows correspond to LIPs associated with supercontinent breakup, black arrows correspond to other LIPs.
One of the main problems in counting orogens is: what constitutes a single orogeny? Collisional orogens of short strike length could be parts of a longer orogen, now displaced by supercontinent breakup. Therefore we have used “orogen segments” in our analyses. In some cases an orogen segment may represent a complete orogen, whereas in others, it may represent only part of a much more extensive orogen. We also have distinguished between collisional and accretionary orogens. Accretionary orogens do not always end with a continent-continent collision, but collisional orogens always do.
Paleomagnetic data provide a quantitative tool for paleogeographic reconstructions. However, the number of high-quality paleomagnetic results is limited, especially for the Early-Middle Paleozoic and the Precambrian. The most complete and reliable global paleogeographic reconstructions for the last 2 Gyr are constrained by both geological and paleomagnetic data. To calculate the average angular velocities of tectonic plates, we used published post-1800 Ma global paleogeographic reconstructions that fulfil the following criteria: (i) all major continental block positions are shown in the reconstructions; (ii) evolving block positions are known in time slices or animations; (iii) reconstructions are made using spherical geometry; and (iv) each reconstruction is made with Euler rotation parameters. Pre-1800 Ma paleogeographic reconstructions are rare and rather controversial. Unfortunately, only the paleomagnetic data from the Superior craton are sufficient for the estimation of mean angular velocities between 2500 and 1800 Ma. As the sizes of continents vary significantly, we calculated the mean angular velocity (in degrees/100 Myr) for each 100-Ma bin by normalising to continental area. We analysed only the movement of continental plates, because the data from oceanic plates are not available for most of the period of interest (≤2.5 Ga).
Peaks in the number of orogens, which probably reflect craton collisions, occur at 1850 and 600 Ma, with smaller peaks at 1100 and 350 Ma (Fig. 1). Distinct minima occur at 1700-1200, 900-700 and 300-200 Ma. Angular plate velocities as weighted by cratonic area vary greatly from about 20 to 80 deg/100 Myr with two peaks at 450-350 Ma and 1100 Ma (60-80 deg/100 Myr). However, the overall trend suggests a gradual speed up of plate tectonics with time. There is no simple relationship in the the frequency of cratonic collision or average plate velocity between supercontinent assemblies and breakups. The assembly of Nuna at 1700-1500 Ma correlates with very low collision rates, whereas the assembly of Rodinia and Gondwana at 1000-850 and 650-350 Ma, respectively, correspond to moderate to high rates. Very low collision rates occur during supercontinent breakup at 2200-2100, 1300-1100, 800-650, and 150-0 Ma. A peak in plate velocity at 450-350 Ma correlates with early growth of Pangea, and another at 1100 Ma with the initial stages of Rodinia’s assembly following the breakup of Nuna.
This project is part of CCFS Theme 2, Earth Evolution, and contributes to understanding Earth’s Architecture and Fluid Fluxes.
Contact: Sergei Pisarevsky
Funded by: CCFS Foundation Program 6: Detecting Earth’s rhythms: Australia’s Proterozoic record in a global context
Highly siderophile elements in the Emeishan LIP
Highly magnesian lavas (picrite) potentially preserve information about the origin and thermochemical state of the mantle sources of large igneous provinces (LIPs). We have carried out high-precision analysis of highly siderophile elements (HSE) in picrites from the ca 260 Ma Emeishan large igneous province (Fig. 1).
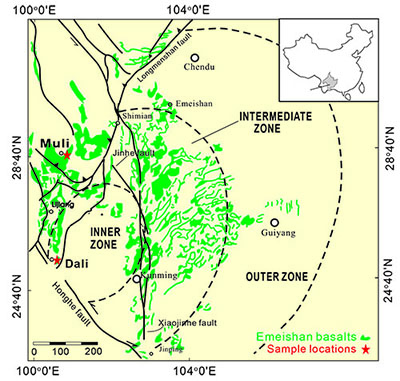
Figure 1. Distribution of the various components of the Emeishan Large Igneous Province, showing sample locations.
The absolute abundances of HSE in the Emeishan picrites are greater than those in MORB and in parental melts of Hawaiian picrites, and similar to the concentrations observed in komatiites (Fig. 2). The CI chondrite-normalised HSE patterns of the studied samples can be divided into two types (Fig. 3). Type 1, represented by the Muli picrites, is similar to that of the primitive upper mantle. Type 2, represented by the Dali picrites, has patterns similar to those of East Greenland and Iceland picrites; more fractionated Pt/Ir (8.6-34.5 with an average of 15.9 ± 8.4) and Pd/Ir (1.3-12.1 with an average 6.6 ±3.0) ratios relative to Type 1.
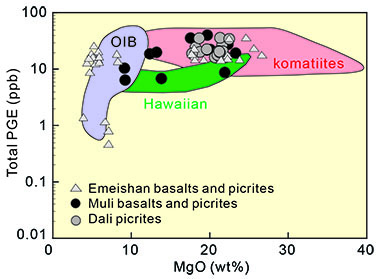
Figure 2. Total PGE contents versus MgO. The reference fields are after Ely and Neal, (2003), the Emeishan basalts and picrites data from Li et al. (2012).
The primary melt compositions of the studied samples were estimated using back addition of equilibrium olivine into selected whole rock compositions (Fig. 4). The estimated HSE abundances in the parental melts of the Dali and Muli picrites are higher than estimates of Hawaiian parental melts. The large range of HSE abundances in the picrites reflects the integrated effects of source heterogeneity, plume-SCLM interaction, partial melting and early fractionation of olivine (± chromite). Together with existing isotopic data, this study shows that the source of the Emeishan plume mantle was chemically heterogeneous.
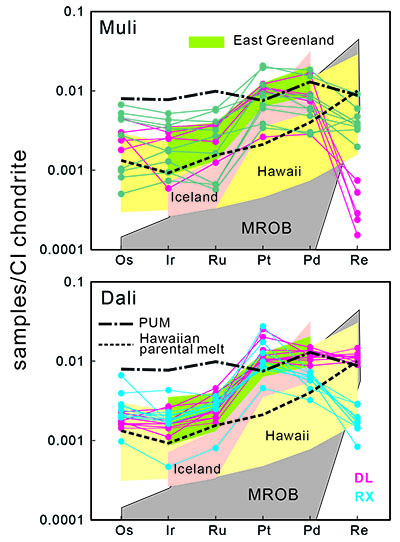
Figure 3. CI-chondrite normalised HSE patterns for (a) Muli and (b) Dali picrites. Primitive upper mantle (PUM) is thought to be representative of fertile peridotites, prior to the removal of material from the upper mantle (Becker et al., 2006). The reference MORB field is modified after Dale et al. (2008). The primitive melt for Hawaiian picrites is an average of individual suite parental melts (Ireland et al., 2009). The normalising values are from McDonough and Sun (1995). Data sources are as follows: east Greenland picrites are from Momme et al. (2006) and Momme et al. (1997); Iceland picrites from Momme et al., (2003); Hawaiian picrites from Bennett et al. (2000), Ireland et al. (2009) and Pitcher et al. (2009).
This project is part of all CCFS Theme 2, Earth Evolution, and contributes to understanding Earth’s Architecture and Fluid Fluxes.
Contacts: Xuan-Ce Wang, Jie Li (GIGCAS, jieli@gig.ac.cn)
Funded by: National Science Foundation of China (No.40903007) and CCFS ESTAR Fellowship
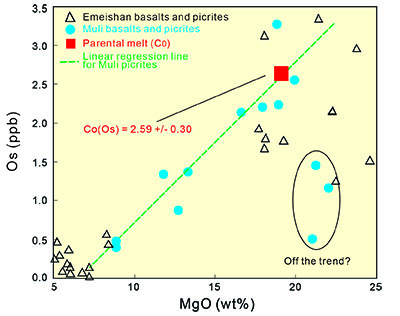
Figure 4. Example of how the HSE content in a parental melt was estimated, using Os abundances of the Muli picrites. The parental melt is assumed to contain 19 wt% MgO, and its Os abundance is determined by linear regression of the data. There are three samples that fall off the regression trend.
From core to ore: Localisation of Earth’s hottest lavas
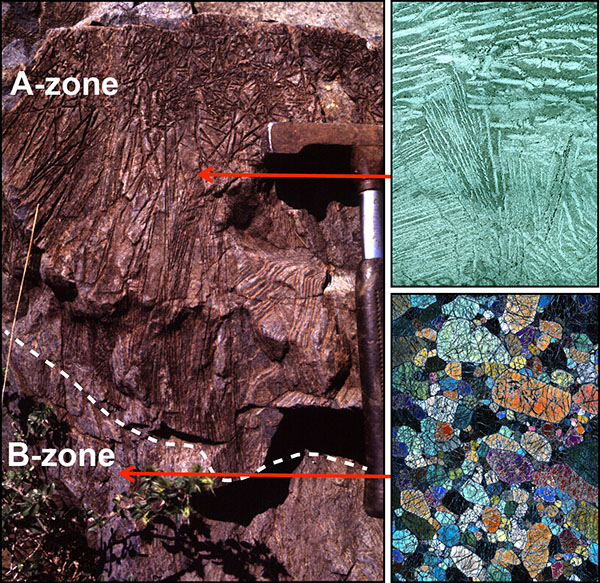
Figure 1. 3.4 billion year old komatiite flow from the Barberton greenstone belt in South Africa, where these ultra-high temperature lavas were first recognised. These lava flows consist of two zones; the A-zone (upper) is dominated by fine, needle-like crystals of olivine called ‘spinifex texture’, while the B-zone (lower) consists of a solid matrix of olivine crystals, which mark the base of the komatiite lava river.
Volcanic eruptions are as old as the planet itself and have inspired awe, curiosity, and sometimes fear since the dawn of the first humans. These dynamic systems are the surface expression of the Earth’s internal heat engine, and demonstrate that our planet is alive internally, as well as externally.
Despite the impressive impact of modern volcanoes, these eruptions and their flows pale in comparison to those that affected our planet in the past. The rarest and most evocative type of volcano is that of the ancient komatiites. These lavas are restricted to the early history of Earth around, 3.4-1.8 billion years ago when the mantle was much hotter. Erupted at temperatures above 1600 °C, they produced hose-like fire fountains, and lava flows that travelled at over 40 kilometres an hour as bluish-white, turbulent lava rivers. These crystallised to form some of the world’s most spectacular igneous rocks, as well as giant nickel deposits, mainly in Western Australia and Canada.
These volcanic rocks have been studied for over 60 years and have been fundamental in developing our knowledge of the thermal and chemical evolution of the planet. However, until recently we did not understand why they formed where they did. Komatiites are found in ancient pieces of crust, called cratons, preserved from the Archean Eon 3.8-2.5 billion years ago. These cratons contain belts of preserved volcanic and sedimentary material, called greenstone belts. One of the largest cratons is Western Australia’s Yilgarn Craton, which hosts most of the gold and nickel ever mined in Australia. This craton contains many greenstone belts but only a few contain major komatiite flows. The uneven distribution of ultra-high temperature lavas is not only a puzzling academic problem, but also is relevant to exploration for nickel ore deposits.
Previous research has demonstrated that komatiites form from mantle plumes - upwelling pipes of hot material that stretch from the outer core to the base of the crust; the modern equivalent is the mantle plume that is forming the Hawaiian island chain. Around 2.7 billion years ago, in a huge global event referred to as a ‘mantle turnover’, multiple mantle plumes formed, and one impacted the base of the Yilgarn Craton, forming the hottest lavas ever erupted on Earth. When plumes first hit the base of the lithosphere - the 50-250 km thick rigid outer shell of the Earth - they spread out into discs of hot material more than 1000 kilometres in diameter. If the plume covered such a large area, why are komatiites confined to specific linear belts?
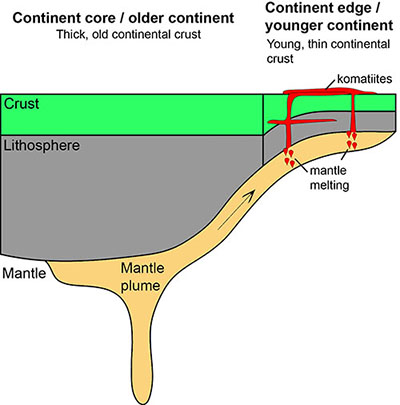
Figure 2. This cartoon demonstrates the main findings of our study. By imaging the older, thicker and younger, thinner areas of ancient lithosphere in the Yilgarn Craton, we were able to map the three-dimensional architecture of the craton and explain why komatiites are localised in specific belts. Plume melts are ‘channeled’ into the younger, thinner continental areas, resulting in a concentration of komatiites and their associated ore deposits in these areas.
CCFS researchers in collaboration with CSIRO and the Geological Survey of Western Australia, set out to answer this question, not by looking at the komatiites, but by studying the slightly younger granites that make up most of the craton. They used Hafnium isotopes in zircon to constrain the age of the rocks that were melted to form the granites and whether they had a mantle or a crustal source. Mapping out the isotopic compositions of the granites revealed a jigsaw pattern in the crust, defined by regions where the granites formed by melting pre-existing, much older crustal rocks, and younger areas where the crust was newly created from sources in the deeper mantle.
Comparing the nature and shape of the ancient continent with the location of the major komatiite events, we found a remarkable correlation. The major komatiite belts and their ore deposits are located at the edge of the older continental regions. This is because of the shape of the base of the ancient Australian continent. As the plume rises, it impacts the older lithosphere first; this is thick and as a result the plume cannot generate much magma. However, the plume flows upwards along the base of the lithosphere, into the shallower, younger areas. Here, huge volumes of magma are generated at the boundary between the old, thick and young, thin areas of the lithosphere. Subsequently, komatiites, and their nickel deposits, are located at the margins of Earth’s early continents.
This project is part of CCFS Theme 1, Early Earth, and contributes to understanding Fluid Fluxes.
Contact: Marco Fiorentini
Funded by: This study was started through ARC Linkage Projects (LP0776780, LP110100667) and finished within the framework of CCFS Flagship Program 2: Genesis, transfer and focus of fluids and metals
Zircon signposts for base metals
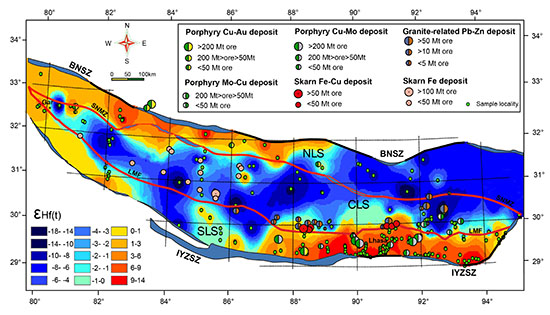
Figure 1. Zircon Hf isotopic mapping of the Lhasa Terrane in Tibet. The colour bands show the Epsilon Hf value of zircons studied. The ore deposits and zircon sample localities are also shown. The warm colours represent relatively juvenile blocks with higher Epsilon (Hf) values, whereas the cold colours represent relatively ancient blocks with lower Epsilon (Hf) values. Abbreviations: IYZSZ = Indus-Yarlung-Tsangpo Suture Zone; BNSZ = Bangong-Nujiang Suture Zone; LMF = Luobadui-Milashan Fault; SNMZ = Shiquanhe-Nam Tso Melange Zone; NLS = Northern Lhasa Subterrane; CLS = Central Lhasa Subterrane; SLS = Southern Lhasa Subterrane.
Zircon multi-isotopic maps are a powerful tool for imaging lithospheric blocks of different age, and have been used in the Yilgarn Craton of Western Australia and the Superior Craton in Canada. Such maps combine in situ zircon U-Pb and Lu-Hf isotopic analyses. The isotopic mapping serves as a form of ‘paleogeophysics’ for imaging ancient lithospheric architecture through time, even when it may not be visible in seismic data
There is a strong spatial correlation between lithospheric boundaries and the concentration of gold in Archean cratons. However, it is unknown whether this is the case for ore deposits in younger orogenic belts such as the world’s largest - the Indo-Asian continental collision zone. Therefore, we have chosen the Lhasa Terrane in southern Tibet to examine the relationship between lithospheric architecture and various types of ore deposits in such orogens.
The Lhasa Terrane is the most metal-rich tectonic unit within the Indo-Asian collision zone with a variety of base metal deposits: copper, molybdenum, iron, lead and zinc (Fig. 1). It previously has been subdivided into northern, central, and southern subterranes, based on the differing sedimentary covers and metamorphic basements (Fig. 1). These three subterranes are separated by the Shiquan River-Nam Tso Melange Zone (SNMZ) and the Luobadui-Milashan Fault (LMF) (red lines on Fig. 1).
The zircon Hf-isotope mapping reveals more complex patterns than that defined by surface geology (Fig. 1). In the northern Lhasa subterrane, the western and eastern segments have high and low Epsilon Hf values, respectively, suggesting a juvenile block in the west and an ancient block in the east. The central Lhasa subterrane is dominated by low Epsilon Hf values, consistent with it being an ancient Precambrian microcontinent. The southern Lhasa subterrane consists of two isotopically juvenile blocks in the west and east, withan ancient block in the middle (Fig. 1). A time slice map at 215-66 Ma, i.e. the period of orogenic accretion before India collided with Asia, reveals the same pattern for the Lhasa Terrane, suggesting that the lithospheric architecture of the Lhasa Terrane formed in the Mesozoic when two juvenile arcs accreted onto an ancient Precambrian microcontinent (Fig. 2a). A time slice map at 65-12 Ma, during the collision, shows that the eastern segment of the southern Lhasa subterrane is very juvenile, consistent with underplating of mantle-derived magmas generated during the Cenozoic collision (Fig. 2b).
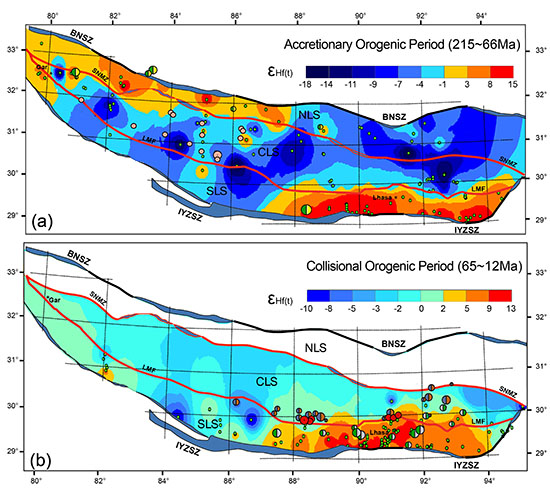
Figure 2. Time slices of zircon Hf isotopic mapping at 215-66 Ma (a) and 65-12 Ma (b). See Figure 1 for Legends.
The Mesozoic subduction-related porphyry Cu-Au deposits and Cenozoic collision-related porphyry Cu-Mo deposits are exclusively located in juvenile crust with high Epsilon Hf values (Figs. 1 and 2). The granite-related Pb-Zn deposits cluster in the oldest crustal regions or are developed along the margin of the old crustal block bounded by lithospheric faults (Fig. 1). The porphyry Mo-Cu deposits are localised along the reworked margins of the old crustal block. Skarn Fe-Cu ore deposits are typically localised along a terrane-boundary fault, through which crustally-derived felsic melts mixed with ascending Cu-rich mantle-derived mafic magmas. Skarn Fe deposits are exclusively located in the ancient crustal region (Fig. 1).
These zircon Hf-isotope maps show temporal-spatial relationships between lithospheric architecture and the location of ore deposits, and demonstrate that the structure, nature and composition of the lithosphere controlled the localisation of ore deposits and the migration of ore-forming metals into the crust. Zircon isotopic mapping is a powerful tool to image the lithospheric architecture of an orogenic terrane, and thus may become a robust pathfinder to base-metal deposits.
This project is part of CCFS Themes 2 and 3, Earth Evolution and Earth Today, and contributes to understanding Earth’s Architecture
Contacts: Yongjun Lu, Zeng-Qian Hou, Cam McCuaig
Funded by: ARC ECSTAR Fellowship, CCFS Foundation Program 9: 4D Lithosphere evolution, CAGS
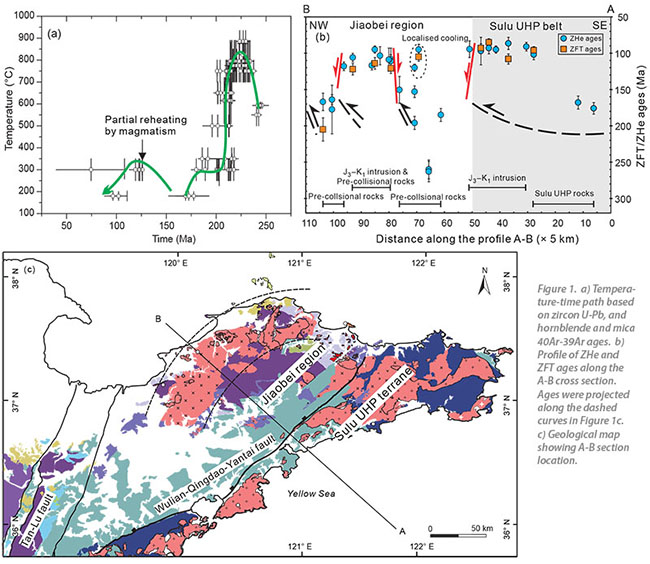
Dissecting a continental collision with thermochronology
How are ultrahigh pressure metamorphic (UHM) rocks exhumed to the surface from mantle or lower-crustal depths? What happens after two continents collide? The clue could lie in the cooling history of UHP belts and the surrounding rocks, and one of the best-exposed and best-studied UHP terranes is the Dabie-Sulu orogenic belt in eastern China.
The Dabie-Sulu orogenic belt formed during the collision of the South China Block (SCB) with the North China Block (NCB) in early Mesozoic time. However, a lack of unambiguous kinematic constraints has made it difficult to verify competing models for the mechanisms of continental collision and exhumation of the UHP rocks. We have applied mica and hornblende 40Ar/39Ar, zircon and apatite fission tracks, and zircon (U-Th)/He dating to both the metamorphic rocks and syn- to late-orogenic granitic intrusions in the Sulu UHP belt and the adjacent Jiaobei region. 40Ar/39Ar and zircon (U-Th)/He data show that the UHP rocks experienced a prominent cooling event at ca 210-160 Ma (Fig. 1a). The Jiaobei region, underlain by the Archean basement of the NCB and located immediately north of the Sulu UHP belt, experienced a localised exhumation at ~260 Ma as well as a Jurassic (196 ± 9 Ma to 164 ± 7 Ma), westward-younging exhumation (Fig. 1b) that overlaps with the exhumation age of the Sulu UHP belt. The ca 260 Ma exhumation probably reflects tectonic erosion at the southern margin of the NCB in response to the initial continental collision, whereas the Jurassic exhumation may be related to an episode of NW-SE tectonic compression. Hence, the 210-160 Ma exhumation in both the Sulu UHP belt and the Jiaobei region is interpreted to reflect erosion in response to northward thrusting of the UHP rocks and the Jiaobei Archean basement. Overall, our results lend strong support to the continental-collision model of Li (1994) in which both the Sulu UHP rocks and the upper crust of the Jiaobei region moved northward along a mid-crustal detachment plane after the UHP rocks were exhumed to upper-crust levels (Fig. 2).
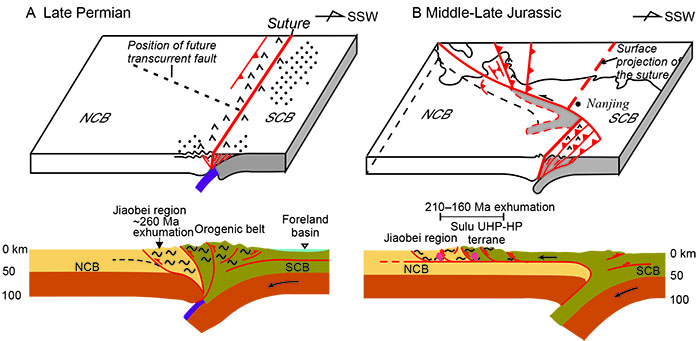
Figure 2. The crustal detachment model that is compatible with observed exhumation events. A) With initial continental collision at ~260 Ma, the Jiaodong region underwent crustal thickening and exhumation. B) By ~210 Ma, the UHP-HP rocks had been exhumed back from the mantle depths to crustal depths. Continuous compression led the UHP-HP rocks to detach from underlying SCB lower crust and move northward along a horizontal detachment until finally climbing the frontal thrust ramp at ~160 Ma. This movement also caused folding and thrusting in the Jiaobei region and exhumation of both the Sulu UHP rocks and the upper crust of the Jiaobei region.
This project is part of CCFS Themes 2 and 3, Earth Evolution and Earth Today, and contributes to understanding Earth’s Architecture and Fluid Fluxes.
Contacts: Li-Ping Liu, Zheng-Xiang Li
Funded by: ARC (DP110104799) and NSFC (41325009)
Cryptic chemical fingerprints identify different origins for ancient regions of Western Australia
CCFS, through close collaboration with the Geological Survey of Western Australia, has produced a world-leading isotopic dataset that integrates U-Pb ages and Lu-Hf data from zircons with geological, geochemical, and geophysical information from across Western Australia. This expansive dataset has refined our understanding of the Proterozoic evolution of Australia. One of the most critical, yet controversial, issues relating to Proterozoic reconstructions of the Australian Continent is the nature, or even existence, of Mesoproterozoic links between the Musgrave Province and the Albany-Fraser Orogen.
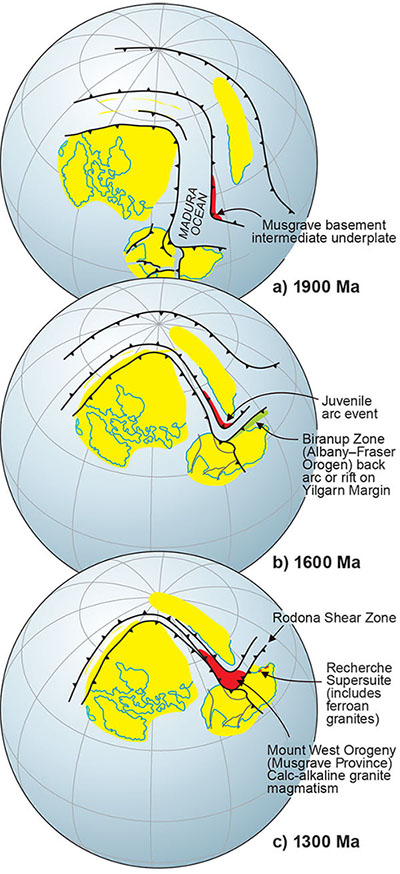
Schematic continental reconstruction of Proterozoic Australia for the interval 1900-1300 Ma (from Howard et al., 2015 Gondwana Research).
The Musgrave Province lies between the North and South Australian Cratons, whereas the Albany-Fraser Orogen lies along the southern and southeastern margin of the Archean Yilgarn Craton. These two belts evolved through temporally similar Mesoproterozoic orogenies at 1345-1260 and 1215-1140 Ma, but on completely different basement. The West and North Australian Cratons amalgamated before the 1345-1260 Ma event, which is interpreted to result from the collision of those combined cratons with the South Australian Craton.
The Paleoproterozoic and Mesoproterozoic history of the Albany-Fraser Orogen involved the reworking of the Yilgarn Craton’s margin, accompanied by significant juvenile mantle input. The orogen’s profile of zircon ages and its Hf- and Nd-isotopic signature reveals an Archean component incorporated into rocks of all ages, which is unequivocally derived from the Yilgarn Craton. The age and isotopic signature of the Albany-Fraser Orogen thus suggests it is an indigenous component of the Yilgarn Craton, rather than an accreted terrane.
This program strand has produced well-defined Nd- and Hf-isotope arrays that track the evolution of the Musgrave Province, through distinct 1950-1900 and 1600-1550 Ma crustal-formation events. Rare non-radiogenic material in the Musgrave Province is only seen in detritus and in magmas that assimilated this material. This evolved detritus, derived from non-Yilgarn and reworked Archean sources, was added to sedimentary basins developed over the Musgrave Province basement from ca 1400 Ma onward. However, the pre-Mesoproterozoic isotopic composition and zircon-age profile for the Musgrave Province is distinctly different from that of the Albany-Fraser Orogen.
If the basement to the Musgrave Province is neither Archean nor part of the West Australian Craton, then what is it? The Madura Province, which lies south of the Musgrave Province, has a radiogenic signature similar to the Musgrave Province and the two provinces probably are contiguous beneath the younger cover sequences. We have found that the crust of the Madura Province contains zircons with 2.0-1.4 Ga mantle extraction ages, and is dominated by juvenile rocks related to oceanic crust that was consumed to the north of the South Australian Craton and east of the West Australian Craton. It appears that the Musgrave Province was formed by modification of Madura-Province crust along the edge of the North Australian Craton. Together, the Musgrave Province and the Madura Province represent Proterozoic Australia’s most juvenile crustal remnant.
The new data indicate that the Musgrave Province developed on a juvenile substrate of Madura Province crust that was subducting beneath, and accreting to, the North Australian-West Australian Craton. During the Mount West Orogeny / Albany-Fraser Orogen at ca 1300 Ma, the Musgrave Province was not an along-strike equivalent of the Albany-Fraser Orogen. At that stage, the Musgrave was an active subduction zone, while the Albany-Fraser Orogen was undergoing orogenic collapse following the earlier accretion of the Loongana arc of the Madura Province to the West Australian Craton.
This project is part of CCFS Theme 2, Earth Evolution, and contributes to understanding Earth’s Architecture.
Contacts: Chris Kirkland, Elena Belousova
Funded by: CCFS Foundation Program 10b.
Mobile lead and spurious zircon ages
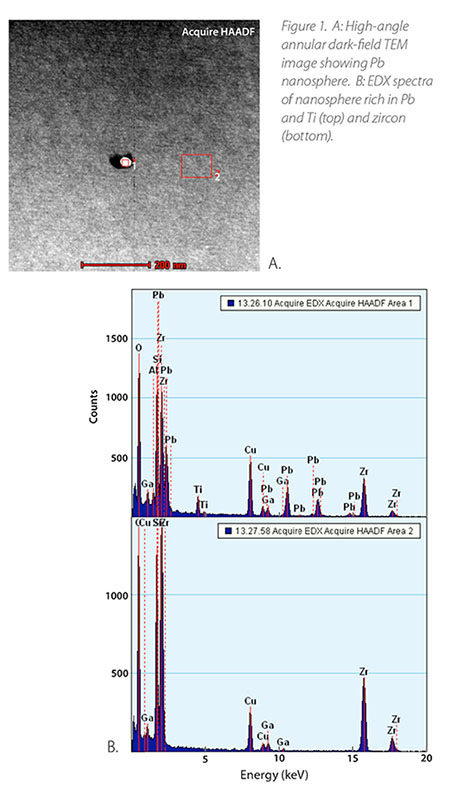
Zircons from metasedimentary and metaigneous gneisses in the Napier Complex (East Antarctica) preserve zircon U-Pb ages greater than 3.8 Ga (Black et al., 1986; Harley, 1997). The complex underwent two metamorphic events; high-temperature metamorphism at ca. 2.8 Ga (Kelly and Harley, 2005) and ultra-high-temperature (T >1100 ºC) at ca 2550-2480 Ma (Harley, 2000). The earliest zircon SHRIMP (Sensitive High Resolution Ion MicroProbe) study of the Napier Complex (Williams et al., 1984)described isotopic disturbance of >3.4 Ga zircons, defined by reversely discordant analyses (i.e. U-Pb ages older than 207Pb/206Pb ages) and within-run instability of Pb during analysis. These results were confirmed recently by ion imaging utilising a Cameca ims 1280 (CCFS Publications #407, 429). These studies revealed the patchy distribution of Pb and Ti and identified the presence of unsupported Pb with anomalously high (>4 Ga) 207Pb/206Pb ages.
Following this discovery, we analysed zircons from three samples: one orthogneiss (from Gage Ridge) and two paragneisses (one each from Mount Sones and Dallwitz Nunatak) by TEM (Transmission Electron Microscopy) applying the site-specific focused-ion-beam (FIB) technique at GeoForschungsZentrum (GFZ) Potsdam in Germany. TEM images revealed that zircon grains from the Napier Complex contain randomly distributed, spherical metallic lead nano-inclusions 5-30 nm in diameter (Kusiak et al., under revision). They occur either as individual droplets (Fig. 1) or together with unidentified phases rich in Ti and silica, which together constitute melt inclusions ca 20-80 nm in diameter. The occurrence of metallic Pb nanospheres in zircons that underwent UHT metamorphism explains the unusual U-Pb behaviour of such grains during SIMS (Secondary Ion Mass Spectrometry) analysis. Further studies are continuing to determine how the nanospheres may have formed. See CCFS Publications #407, 429.
This project is part of CCFS Theme 1, Early Earth, and contributes to understanding Earth’s Architecture.
Contacts: Monika A. Kusiak, Simon A. Wilde
Funded by: EU-FP7, Marie Curie grant
References:
Black, L.P., Sheraton, J.W., James, P.R. 1986. Late Archean Granites of the Napier Complex, Enderby Land, Antarctica - a Comparison of Rb-Sr, Sm-Nd and U-Pb Isotopic Systematics in a Complex Terrain. Precambrian Research, 32, 4, 343-368.
Harley, S.L., Black, L.P. 1997. A revised Archaean chronology for the Napier Complex, Enderby Land, from SHRIMP ion-microprobe studies. Antarctic Science, 9, 74-91
Harley, S.L., Motoyoshi, Y. 2000. Al zoning in orthopyroxene in a sapphirine quartzite: Evidence for >1120 ºC UHT metamorphism in the Napier Complex, Antarctica, and implications for the entropy of sapphirine. Contributions to Mineralogy and Petrology, 138: 293-307.
Kelly, N.M., Harley, S.L. 2005. Timing of zircon growth during highgrade metamorphism: Constraints from garnet-zircon REE. Geochimica et Cosmochimica Acta, 69. 10, A22-A22.
Kusiak, M.A. et al., under revision. Metallic lead nanospheres discovered in ancient zircons. Proceedings of the National Academy of Sciences of the United States of America.
Williams, I.S., Compston, W., Black, L.P., Ireland, T.R., Foster, J.J. 1984. Unsupported Radiogenic Pb in Zircon - a Cause of Anomalously High Pb-Pb, U-Pb and Th-Pb Ages. Contributions to Mineralogy and Petrology, 88, 4, 322-327.
The Hadean - Archean crust-mantle revolution: How should we divide the Archean?
When and how did the continents on which we live form and stabilise in the torrid early history of our evolving planet? We have used the mineral zircon as time capsules to record the history of events in the Earth’s crust from trace-element and isotopic data (U-Pb and Lu-Hf). Sulfide minerals and metal alloys from mantle-derived samples (brought to the Earth’s surface by magmas from 50 to 600 km deep), record the history of fluid, melting and formation events in the mantle using the Re-Os isotopic system. The combination of these two powerful tools allows time travel back to early Earth times and has produced some rare insights, changing our understanding of the timing of significant ancient upheavals that shaped Earth’s crust.
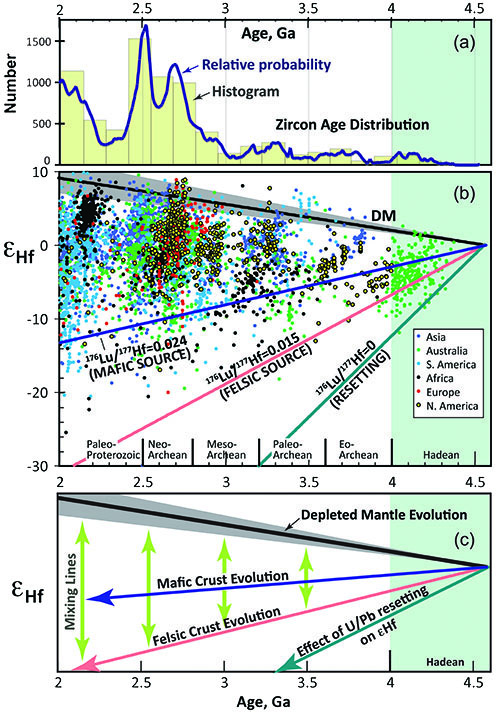
Figure 1. εHf vs age for zircons worldwide, divided by region. The database (n=6699) builds on the data of Belousova et al. (2010) updated with >2000 analyses published, and/or produced in our laboratories, after 2009. The conventional subdivision of the Hadean and Archean is shown along the X axis. (a) zircon age distribution shown as a histogram and a cumulative-probability curve. (b) distribution of Hf-isotope data. The “juvenile band”, defined as ±0.75% of the εHf of the Depleted Mantle line at any time, is shown as a grey envelope. Evolution lines from 4.5 Ga are shown for reservoirs corresponding to typical mafic rocks (176Lu/177Hf = 0.024), the average continental crust (176Lu/177Hf = 0.015), and zircons, approximated by 176Lu/177Hf = 0. (c) shows these evolution lines.
We have integrated a worldwide compilation of the ages of crust and mantle events from 2 billion years ago until nearly the time of formation of planet Earth at ~4.5 billion years, allowing us to track patterns of evolution of the crust, and interaction between the mantle and crust. These data show that from about 4.5 to 3.4 billion years ago, the Earth’s crust was essentially stagnant (like a lid on a hot cauldron), and was mainly basaltic in composition.
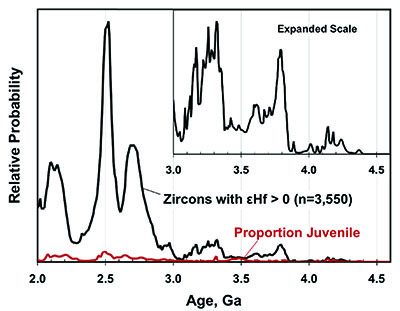
Figure 2. (a) Cumulative-probability curve and age histogram for all zircons with εHf falling within 0.75% of the Depleted Mantle curve in Figure 1. Inset uses an expanded scale to show detail in the oldest datasets.
Data suggest that some zircons crystallised from magmas that were possibly generated by impact melting from bombarding planetary bodies (meteorites large and small). Pulses of magmatic activity at about 4.2, 3.8, and 3.3-3.4 billion years, possibly representing mantle convective overturns or rising mantle plumes, broke this quiescent state.
Between these pulses, there is evidence of resetting of zircon U-Pb ages (by impact?) but the Hf-isotope data (Fig. 1) allow us to see back through such events and imply that there was no further generation of new crust. There is thus no evidence of plate-tectonic activity, as described for the Earth in the state we know it today (i.e. through the Phanerozoic Era), before about 3.4 billion years ago. Previous modelling studies indicate that the early Earth may have been characterised by an episodic-overturn, or a stagnant-lid, regime. New thermodynamic modeling (CCFS Publication #488) confirms that an initially hot Earth could have a stagnant lid for ca 300 million years, and then experience a series of massive overturns at intervals on the order of 150 Ma, until the end of the EoArchean Period (earliest Archean time). The lack of older Os model ages (Fig. 2) suggests that subcontinental lithospheric mantle (SCLM) sampled on Earth today did not exist before about 3.5 billion years ago.
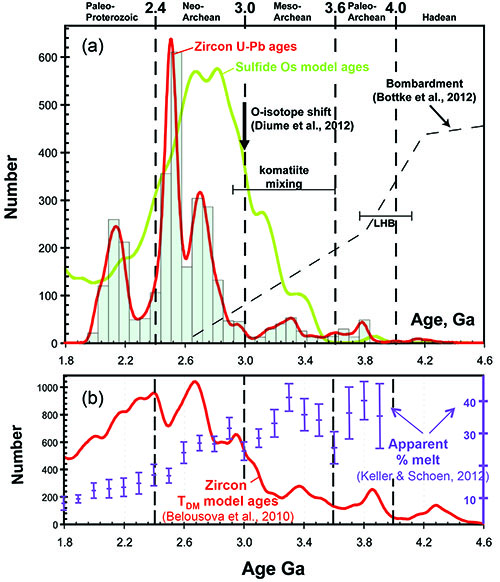
Figure 3. Summary of crust-mantle evolution. Grey histogram shows distribution of all zircons in the database for the time period shown; red line shows the probability distribution of these ages. Green line shows distribution of Re-Os TRD model ages for sulfides in mantle-derived xenoliths and xenocrysts. The revised distribution of meteorite bombardment intensity (Bottke et al., 2012) and a generalized summary of older interpretations of the “Late Heavy Bombardment” is shown as LHB. The homogenization of PGE contents in komatiites from 3.5-2.9 Ga (Maier et al., 2010) may mark the major mantle-overturn/circulation events discussed in the text. The O-isotope shift noted by Dhuime et al. (2012) marks the beginning of a quiescent period, or perhaps the destruction of the crust during the major overturns from 3.5-2.9 Ga.
A lull in crustal production around 3.0 billion years coincides with the rapid buildup of Mg0-rich, buoyant SCLM, which peaked around 2.7-2.8 billion years; this pattern is consistent with one or more major mantle overturns. The generation of continental crust peaked later in two main pulses at about 2.75 and 2.5 billion years ago (Belousova et al., 2010). The age/Hf-isotope patterns of the crust generated from 3.0-2.4 billion years are similar to those in old tectonic regions of the Gondwana supercontinent, implying the existence of plate tectonics at the time of assembly of the ancient supercontinent (Kenorland) ca 2.5 billion years ago. We have demonstrated a clear link in these data between the generation of the SCLM and the emergence of modern plate tectonics; we consider this link to be causal, as well as temporal.
The International Geologic Time Scale sets the Hadean-Archean boundary at 4.0 Ga and divides the Archean into four approximately equal time slices (Fig. 1): Eo-Archean (4.0-3.6 Ga (Ga = billion years ago)), Paleo-Archean (3.6-3.2 Ga), Meso-Archean (3.2-2.8 Ga) and Neo-Archean (2.8-2.5 Ga). There is no apparent evidence in the present datasets for these divisions, and we suggest a simplified subdivision, based on the changes in tectonic style (Fig. 3) at identifiable times.
In the absence of better data, we accept the Hadean-Archean boundary at 4.0 Ga, although we suggest that the stagnant-lid regime may have continued for another 500-800 million years. We propose that the term Eo-Archean be discarded, since there is little preserved evidence of magmatic activity between 4.2 and 3.8 billion years, and that the term PaleoArchean be used for the period 4.0-3.6 billion years; this timespan contains the oldest preserved crust, and inferred evidence for one major overturn. MesoArchean could be applied to the period 3.6-3.0 billion years, during which overturns became more prominent, ending with the buildup toward the major 2.8-2.55 billion years, magmatism that accompanied the building of the bulk of the Archean SCLM. NeoArchean can be usefully applied to the period 3.0-2.4 billion years, which marks a new tectonic style with frequent plume activity, the beginning of some form of plate tectonics, and the preservation of large volumes of continental crust. The zircon data suggest that this activity continued up to about 2.4 billion years ago, and then ceased quite abruptly, marking a natural end to the Neo-Archean period, and heralding a new geotectonic regime for Earth.
This project is part of CCFS Themes 1 and 2, Early Earth and Earth Evolution, and contributes to understanding Earth’s Architecture.
Contacts: Bill Griffin, Elena Belousova, Suzanne O’Reilly
Funded by: CCFS Foundation Program; TARDIS: Tracking ancient residues distributed in the silicate Earth, Future Fellowship to Elena Belousova